

ProteinSeq: high-performance proteomic analyses by proximity ligation and next generation sequencing
- PMID: 21980495
- PMCID: PMC3183061
- DOI: 10.1371/journal.pone.0025583
ProteinSeq: high-performance proteomic analyses by proximity ligation and next generation sequencing
Abstract
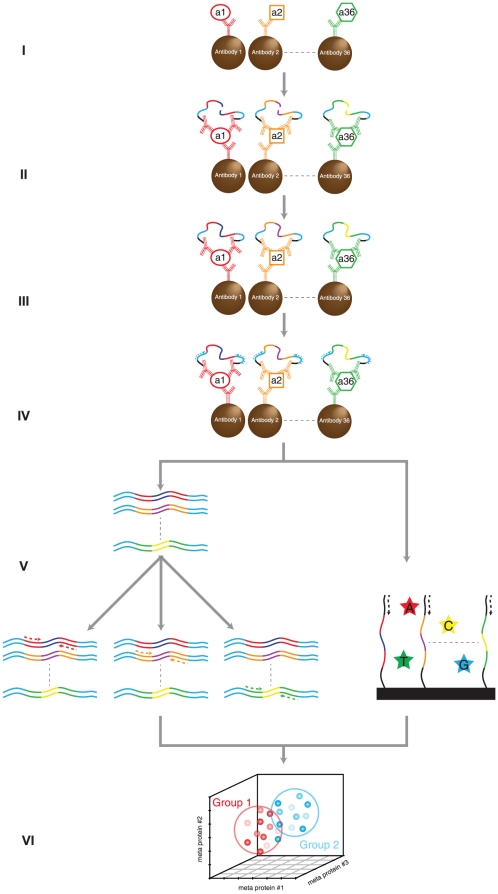
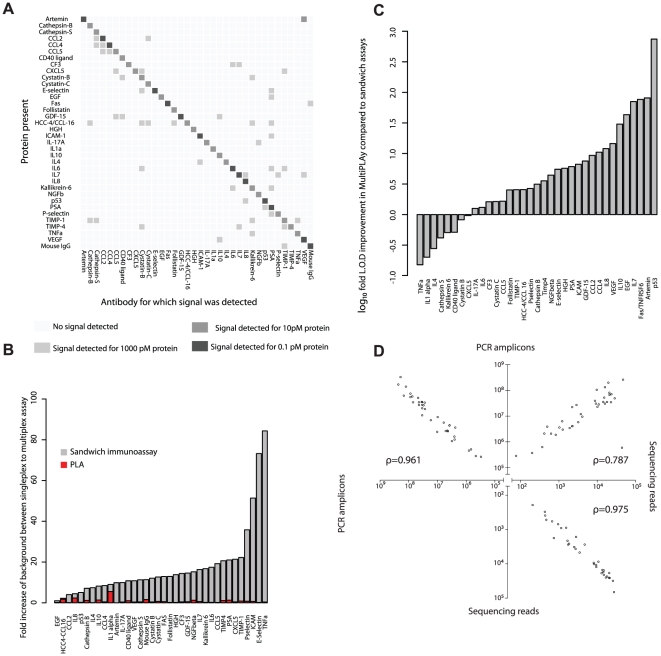
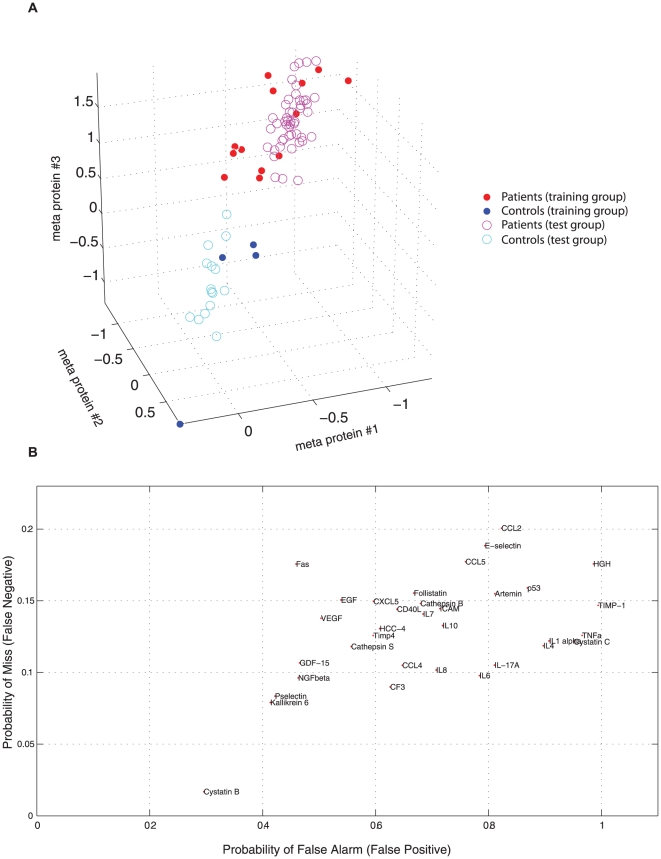
Despite intense interest, methods that provide enhanced sensitivity and specificity in parallel measurements of candidate protein biomarkers in numerous samples have been lacking. We present herein a multiplex proximity ligation assay with readout via realtime PCR or DNA sequencing (ProteinSeq). We demonstrate improved sensitivity over conventional sandwich assays for simultaneous analysis of sets of 35 proteins in 5 µl of blood plasma. Importantly, we observe a minimal tendency to increased background with multiplexing, compared to a sandwich assay, suggesting that higher levels of multiplexing are possible. We used ProteinSeq to analyze proteins in plasma samples from cardiovascular disease (CVD) patient cohorts and matched controls. Three proteins, namely P-selectin, Cystatin-B and Kallikrein-6, were identified as putative diagnostic biomarkers for CVD. The latter two have not been previously reported in the literature and their potential roles must be validated in larger patient cohorts. We conclude that ProteinSeq is promising for screening large numbers of proteins and samples while the technology can provide a much-needed platform for validation of diagnostic markers in biobank samples and in clinical use.
Conflict of interest statement
Figures
Similar articles
-
Solid-phase proximity ligation assays for individual or parallel protein analyses with readout via real-time PCR or sequencing.Nat Protoc. 2013 Jun;8(6):1234-48. doi: 10.1038/nprot.2013.070. Epub 2013 May 30. Nat Protoc. 2013. PMID: 23722261
-
Emerging Affinity-Based Proteomic Technologies for Large-Scale Plasma Profiling in Cardiovascular Disease.Circulation. 2017 Apr 25;135(17):1651-1664. doi: 10.1161/CIRCULATIONAHA.116.025446. Circulation. 2017. PMID: 28438806 Free PMC article. Review.
-
Sensitive plasma protein analysis by microparticle-based proximity ligation assays.Mol Cell Proteomics. 2010 Feb;9(2):327-35. doi: 10.1074/mcp.M900248-MCP200. Epub 2009 Nov 27. Mol Cell Proteomics. 2010. PMID: 19955079 Free PMC article.
-
Parallel barcoding of antibodies for DNA-assisted proteomics.Proteomics. 2014 Nov;14(21-22):2432-6. doi: 10.1002/pmic.201400215. Proteomics. 2014. PMID: 25263329
-
Multiplexing Biomarker Methods, Proteomics and Considerations for Alzheimer's Disease.Adv Exp Med Biol. 2017;974:21-48. doi: 10.1007/978-3-319-52479-5_2. Adv Exp Med Biol. 2017. PMID: 28353223 Review.
Cited by
-
Multiplex protein detection with DNA readout via mass spectrometry.N Biotechnol. 2013 Jan 25;30(2):153-8. doi: 10.1016/j.nbt.2012.11.003. Epub 2012 Nov 28. N Biotechnol. 2013. PMID: 23201185 Free PMC article.
-
An ex vivo tissue model of cartilage degradation suggests that cartilage state can be determined from secreted key protein patterns.PLoS One. 2019 Oct 21;14(10):e0224231. doi: 10.1371/journal.pone.0224231. eCollection 2019. PLoS One. 2019. PMID: 31634377 Free PMC article.
-
A covalent and cleavable antibody-DNA conjugation strategy for sensitive protein detection via immuno-PCR.Sci Rep. 2016 Mar 7;6:22675. doi: 10.1038/srep22675. Sci Rep. 2016. PMID: 26947912 Free PMC article.
-
Plasma proteins associated with cardiovascular death in patients with chronic coronary heart disease: A retrospective study.PLoS Med. 2021 Jan 13;18(1):e1003513. doi: 10.1371/journal.pmed.1003513. eCollection 2021 Jan. PLoS Med. 2021. PMID: 33439866 Free PMC article.
-
Mass spectrometry based metabolomics for in vitro systems pharmacology: pitfalls, challenges, and computational solutions.Metabolomics. 2017;13(7):79. doi: 10.1007/s11306-017-1213-z. Epub 2017 May 19. Metabolomics. 2017. PMID: 28596718 Free PMC article.
References
-
- Metzker ML. Sequencing technologies - the next generation. Nature reviews Genetics. 2010;11:31–46. - PubMed
-
- Hanash SM, Pitteri SJ, Faca VM. Mining the plasma proteome for cancer biomarkers. Nature. 2008;452:571–579. - PubMed
-
- Anderson NL. The clinical plasma proteome: a survey of clinical assays for proteins in plasma and serum. Clinical chemistry. 2010;56:177–185. - PubMed
-
- Anderson NL, Anderson NG, Haines LR, Hardie DB, Olafson RW, et al. Mass spectrometric quantitation of peptides and proteins using Stable Isotope Standards and Capture by Anti-Peptide Antibodies (SISCAPA). J Proteome Res. 2004;3:235–244. - PubMed
Publication types
MeSH terms
Substances
LinkOut - more resources
Full Text Sources
Other Literature Sources
Research Materials
