. 2011;6(9):e25607.
doi: 10.1371/journal.pone.0025607. Epub 2011 Sep 29.

Changes in early cortical visual processing predict enhanced reactivity in deaf individuals

Affiliations

Changes in early cortical visual processing predict enhanced reactivity in deaf individuals

Davide Bottari et al. PLoS One. 2011.

Abstract

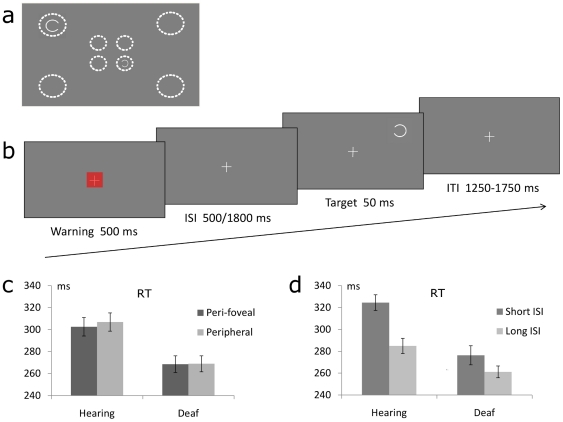
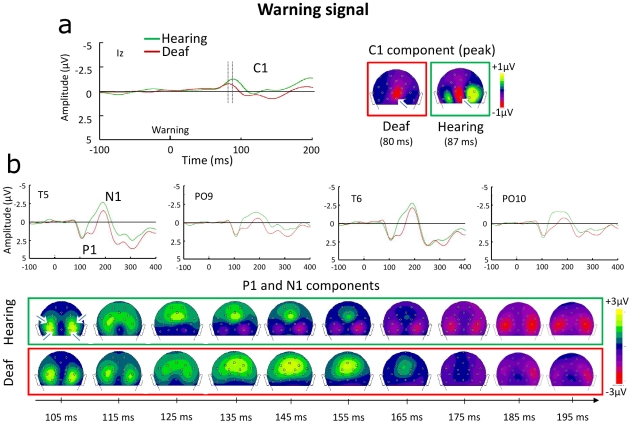
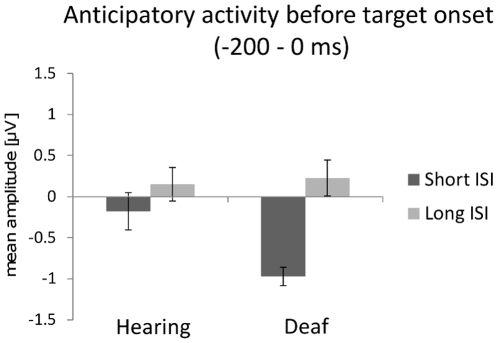
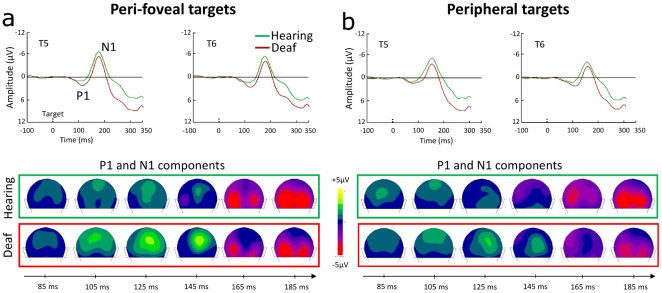
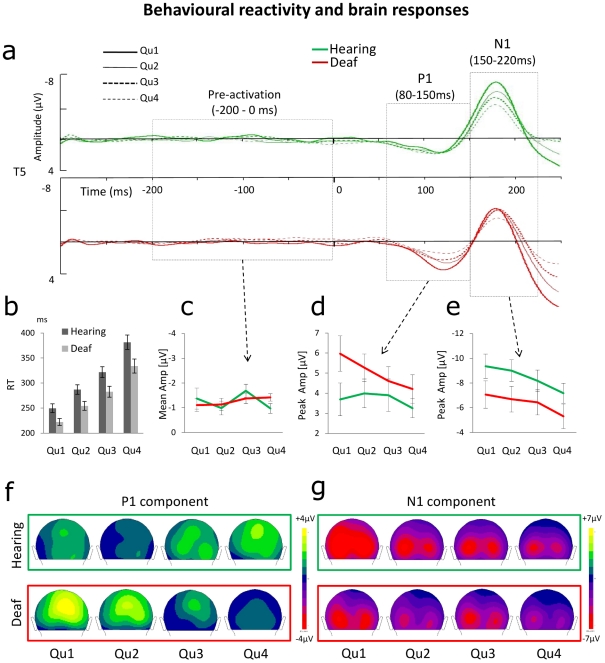
Individuals with profound deafness rely critically on vision to interact with their environment. Improvement of visual performance as a consequence of auditory deprivation is assumed to result from cross-modal changes occurring in late stages of visual processing. Here we measured reaction times and event-related potentials (ERPs) in profoundly deaf adults and hearing controls during a speeded visual detection task, to assess to what extent the enhanced reactivity of deaf individuals could reflect plastic changes in the early cortical processing of the stimulus. We found that deaf subjects were faster than hearing controls at detecting the visual targets, regardless of their location in the visual field (peripheral or peri-foveal). This behavioural facilitation was associated with ERP changes starting from the first detectable response in the striate cortex (C1 component) at about 80 ms after stimulus onset, and in the P1 complex (100-150 ms). In addition, we found that P1 peak amplitudes predicted the response times in deaf subjects, whereas in hearing individuals visual reactivity and ERP amplitudes correlated only at later stages of processing. These findings show that long-term auditory deprivation can profoundly alter visual processing from the earliest cortical stages. Furthermore, our results provide the first evidence of a co-variation between modified brain activity (cortical plasticity) and behavioural enhancement in this sensory-deprived population.


Conflict of interest statement

Competing Interests: The authors have declared that no competing interests exist.

Figures

Figure 1
Figure 1. Experimental protocol and behavioural results.
(a) The target was a single circle opened on the left or right side, presented at one of 8 possible locations. Peri-foveal targets were centred at 3° from fixation and covered a visual angle of 1.5°; peripheral targets were centred at 8° from fixation and covered a visual angle of 2.6° (i.e., targets were corrected for the cortical magnification factor). Dotted place-holders and examples of targets are shown in (a) for illustrative purposes only. (b) Each trial began with a warning signal (a red square covering 1.5° of visual angle, presented for 500 ms). The inter-stimulus intervals (ISIs) between the warning signal and the target were, equiprobably, either 500 ms (short ISI) or 1800 ms (long ISI). The target appeared for 50 ms, at any of the 8 possible locations randomly. Participants were instructed to press the response button as soon as possible. The inter-trial interval (ITI) ranged randomly between 1250 and 1750 ms. (c, d) Mean (of individual subjects medians) response times (RTs) for deaf and hearing participants as a function of (c) target eccentricity (perifoveal or peripheral) and (d) ISI (short or long) between the warning and the target. Deaf were overall faster than hearing controls. In addition, they showed no RT cost when reacting to peripheral vs. perifoveal targets, unlike hearing controls (c). Finally, the ISI modulated the reactivity performance in the two groups (d).
Figure 2
Figure 2. Brain responses to the central warning signal in deaf subjects and in hearing controls.
(a) Visual ERPs and topography of the C1 component around its peak latency for each group. Arrows indicate the electrode (Iz) at which the ERP curves are shown. (Note that because the C1 peak latency is later in hearing controls than in deaf participants, the emerging P1 can be seen for the controls on each side of the C1 in this figure.) (b) P1 and N1 responses at 4 posterior electrodes (T5, PO9, T6, PO10, identified by arrows in the first potential map). The P1 components have a similar profile in the two subjects groups until about 125 ms, then deaf subjects present a second positive deflection (145 ms) compared to hearing controls. The prolonged positivity in deaf subjects (145–165 ms) is clearly seen in the spatiotemporal distribution of the responses (back view of the head). By contrast, although the negative N1 component emerged earlier in control than in deaf subjects, there was no difference in morphology or topography between the two subjects groups.
Figure 3
Figure 3. Anticipatory activity recorded before target onset.
Deaf individuals show enhanced anticipatory activity (mean amplitude over the 200 ms preceding target onset, with a −300 to −200 ms baseline) compared to hearing controls for target presented at short ISI.
Figure 4
Figure 4. Brain responses to (a) peri-foveal and (b) peripheral targets.
Upper panels show ERPs at T5 and T6 electrodes for the targets. Lower panels show spatiotemporal distribution of the responses between 85 and 185 ms in each group. Like in the responses to the warning signal, the P1 component is prolonged in deaf compared to hearing subjects, whereas the N1 is similar.
Figure 5
Figure 5. Correlation between behavioural reactivity and brain responses.
The figure depicts the main ERP components as a function of RTs in deaf individuals and in hearing controls. (a, b) For each participant trials were sorted into 4 quartiles as a function of the response speed, from the fastest (Qu1) to the slowest (Qu4), and ERPs were averaged within each quartile. (c) In both groups the mean amplitude of the pre-stimulus activity (leftmost dashed area in (a) see text) was unrelated to the RTs. (d) By contrast, the peak amplitude of the P1 component (central dashed area in (a)) decreases linearly as a function of RTs in deaf participants, but not in hearing controls. (e) Finally, in both groups the peak amplitude of the N1 component (rightmost dashed area in (a) decreased monotonically as a function of RTs. The lower panel illustrates these results by showing the topographies of the P1 (f) and N1 (g) components around their respective peak latencies in both subjects' groups as a function of the four quartiles: the potential fields related to P1 peak decrease with increasing RTs only for the deaf group, whereas N1 potentials decrease similarly in the two groups with increasing RTs.

Similar articles

Cited by

References

    1. Loke WH, Song S. Central and peripheral visual processing in hearing and nonhearing individuals. Bulletin of the Psychonomic Society. 1991;29:437–440.
    1. Reynolds HN. Effects of foveal stimulation on peripheral visual processing and laterality in deaf and hearing subjects. The American Journal of Psychology. 1993;106:523–540. - PubMed
    1. Bottari D, Nava E, Ley P, Pavani F. Enhanced reactivity to visual stimuli in deaf individuals. Restorative Neurology and Neuroscience. 2010;28:167–179. - PubMed
    1. Pavani F, Bottari D. Visual abilities in individuals with profound deafness: a critical review. In: Murray MM, Wallace M, editors. Frontiers in the Neural Bases of Multisensory Processes. Boca Raton, FL: CRC Press; in press. - PubMed
    1. Neville HJ, Lawson D. Attention to central and peripheral visual space in a movement detection task: an event-related potential and behavioral study. II. Congenitally deaf adults. Brain Research. 1987;405:268–283. - PubMed

Publication types