

Dephosphorylated NSSR1 is induced by androgen in mouse epididymis and phosphorylated NSSR1 is increased during sperm maturation
- PMID: 21980524
- PMCID: PMC3183062
- DOI: 10.1371/journal.pone.0025667
Dephosphorylated NSSR1 is induced by androgen in mouse epididymis and phosphorylated NSSR1 is increased during sperm maturation
Abstract
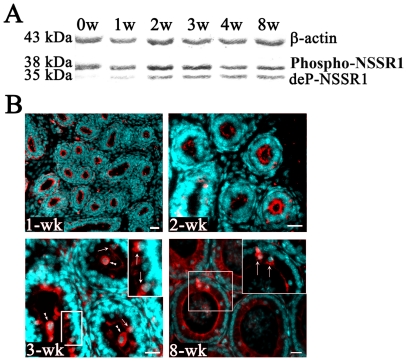
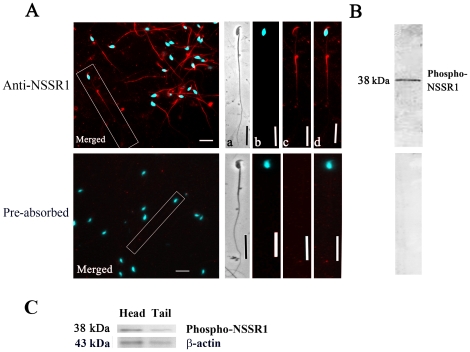
NSSR1 (Neural salient serine/arginine rich protein 1, alternatively SRp38) is a newly identified RNA splicing factor and predominantly expressed in neural tissues. Here, by Western blot analysis and immunofluorescent staining, we showed that the expression of dephosphorylated NSSR1 increased significantly during development of the caput epididymis. In adult mice, phosphorylated NSSR1 was mainly expressed in the apical side of epithelial cells, and dephosphorylated NSSR1 in caput epididymis was upregulated in a testosterone dependent manner. In addition, subcellular immunoreactive distribution of NSSR1 varied in different regions of the epididymis. With respect to the sperm, phosphorylated NSSR1 was detected in the mid-piece of the tail as well as the acrosome. Furthermore, NSSR1 was released from the sperm head during the capacitation and acrosome reaction. These findings for the first time provide the evidence for the potential roles of NSSR1 in sperm maturation and fertilization.
Conflict of interest statement
Figures


Similar articles
-
NSSR1 is regulated in testes development and cryptorchidism and promotes the exon 5-included splicing of CREB transcripts.Mol Reprod Dev. 2007 Nov;74(11):1363-72. doi: 10.1002/mrd.20719. Mol Reprod Dev. 2007. PMID: 17427975
-
NSSR1 is regulated by testosterone in the mouse uterus and extensively expressed in endometrial carcinoma.Tumour Biol. 2011 Apr;32(2):359-66. doi: 10.1007/s13277-010-0128-3. Epub 2010 Nov 12. Tumour Biol. 2011. PMID: 21072693
-
[Expression of neural salient serine-/arginine-rich protein 1 (NSSR1) in colorectal cancer].Zhejiang Da Xue Xue Bao Yi Xue Ban. 2011 Sep;40(5):540-4. Zhejiang Da Xue Xue Bao Yi Xue Ban. 2011. PMID: 21984158 Chinese.
-
The impact of epididymal proteins on sperm function.Reproduction. 2019 Nov;158(5):R155-R167. doi: 10.1530/REP-18-0589. Reproduction. 2019. PMID: 31176304 Review.
-
Transcriptional networks in the human epididymis.Andrology. 2019 Sep;7(5):741-747. doi: 10.1111/andr.12629. Epub 2019 May 2. Andrology. 2019. PMID: 31050198 Free PMC article. Review.
Cited by
-
Disruption of Microtubules Post-Virus Entry Enhances Adeno-Associated Virus Vector Transduction.Hum Gene Ther. 2016 Apr;27(4):309-24. doi: 10.1089/hum.2016.008. Hum Gene Ther. 2016. PMID: 26942476 Free PMC article.
-
SRSF10 is essential for progenitor spermatogonia expansion by regulating alternative splicing.Elife. 2022 Nov 10;11:e78211. doi: 10.7554/eLife.78211. Elife. 2022. PMID: 36355419 Free PMC article.
-
SRSF10: an atypical splicing regulator with critical roles in stress response, organ development, and viral replication.RNA. 2021 Nov;27(11):1302-1317. doi: 10.1261/rna.078879.121. Epub 2021 Jul 27. RNA. 2021. PMID: 34315816 Free PMC article. Review.
References
-
- Black DL. Protein diversity from alternative splicing: a challenge for bioinformatics and post-genome biology. Cell. 2000;103:367–370. - PubMed
-
- Johnson JM, Castle J, Garrett-Engele P, Kan Z, Loerch PM, et al. Genome-wide survey of human alternative pre-mRNA splicing with exon junction microarrays. Science. 2003;302:2141–2144. - PubMed
-
- Smith CW, Valcarcel J. Alternative pre-mRNA splicing: the logic of combinatorial control. Trends Biochem Sci. 2000;25:381–388. - PubMed
-
- Jurica MS, Moore MJ. Pre-mRNA splicing: awash in a sea of proteins. Mol Cell. 2003;12:5–14. - PubMed
-
- Lopez AJ. Alternative splicing of pre-mRNA: developmental consequences and mechanisms of regulation. Annu Rev Genet. 1998;32:279–305. - PubMed
Publication types
MeSH terms
Substances
LinkOut - more resources
Full Text Sources
Molecular Biology Databases
Research Materials
