

Theoretical design and analysis of multivolume digital assays with wide dynamic range validated experimentally with microfluidic digital PCR
- PMID: 21981344
- PMCID: PMC3216679
- DOI: 10.1021/ac201658s
Theoretical design and analysis of multivolume digital assays with wide dynamic range validated experimentally with microfluidic digital PCR
Abstract
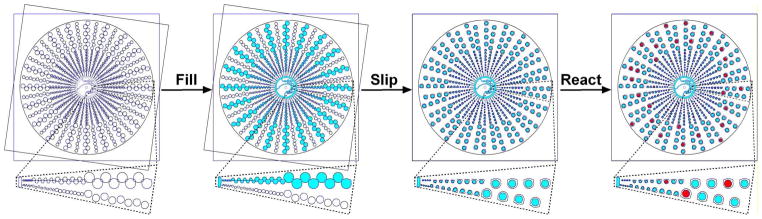
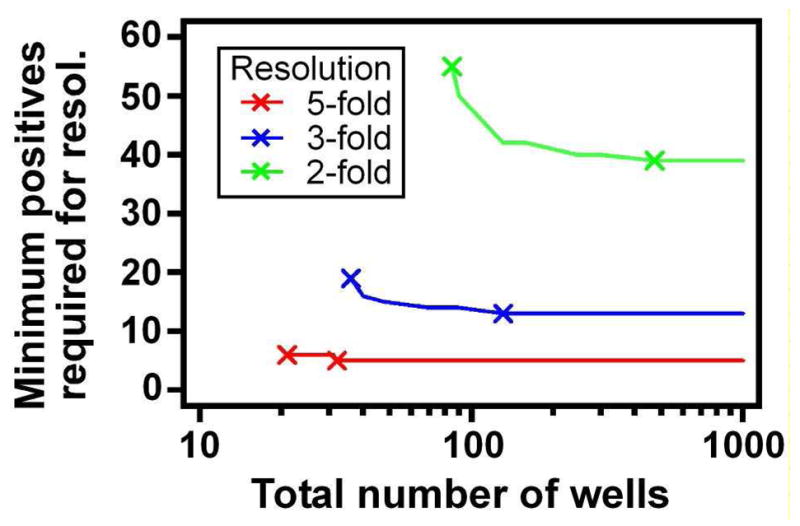
This paper presents a protocol using theoretical methods and free software to design and analyze multivolume digital PCR (MV digital PCR) devices; the theory and software are also applicable to design and analysis of dilution series in digital PCR. MV digital PCR minimizes the total number of wells required for "digital" (single molecule) measurements while maintaining high dynamic range and high resolution. In some examples, multivolume designs with fewer than 200 total wells are predicted to provide dynamic range with 5-fold resolution similar to that of single-volume designs requiring 12,000 wells. Mathematical techniques were utilized and expanded to maximize the information obtained from each experiment and to quantify performance of devices and were experimentally validated using the SlipChip platform. MV digital PCR was demonstrated to perform reliably, and results from wells of different volumes agreed with one another. No artifacts due to different surface-to-volume ratios were observed, and single molecule amplification in volumes ranging from 1 to 125 nL was self-consistent. The device presented here was designed to meet the testing requirements for measuring clinically relevant levels of HIV viral load at the point-of-care (in plasma, <500 molecules/mL to >1,000,000 molecules/mL), and the predicted resolution and dynamic range was experimentally validated using a control sequence of DNA. This approach simplifies digital PCR experiments, saves space, and thus enables multiplexing using separate areas for each sample on one chip, and facilitates the development of new high-performance diagnostic tools for resource-limited applications. The theory and software presented here are general and are applicable to designing and analyzing other digital analytical platforms including digital immunoassays and digital bacterial analysis. It is not limited to SlipChip and could also be useful for the design of systems on platforms including valve-based and droplet-based platforms. In a separate publication by Shen et al. (J. Am. Chem. Soc., 2011, DOI: 10.1021/ja2060116), this approach is used to design and test digital RT-PCR devices for quantifying RNA.
Figures


Similar articles
-
Multiplexed quantification of nucleic acids with large dynamic range using multivolume digital RT-PCR on a rotational SlipChip tested with HIV and hepatitis C viral load.J Am Chem Soc. 2011 Nov 9;133(44):17705-12. doi: 10.1021/ja2060116. Epub 2011 Oct 13. J Am Chem Soc. 2011. PMID: 21995644 Free PMC article.
-
Experimental investigation of confinement effect in single molecule amplification via real-time digital PCR on a multivolume droplet array SlipChip.Anal Chim Acta. 2024 May 22;1304:342541. doi: 10.1016/j.aca.2024.342541. Epub 2024 Mar 28. Anal Chim Acta. 2024. PMID: 38637051
-
Self-partitioning SlipChip for slip-induced droplet formation and human papillomavirus viral load quantification with digital LAMP.Biosens Bioelectron. 2020 May 1;155:112107. doi: 10.1016/j.bios.2020.112107. Epub 2020 Feb 18. Biosens Bioelectron. 2020. PMID: 32090872
-
[Digital PCR compartmentalization I. Single-molecule detection of rare mutations].Med Sci (Paris). 2015 Jan;31(1):84-92. doi: 10.1051/medsci/20153101017. Epub 2015 Feb 6. Med Sci (Paris). 2015. PMID: 25658735 Review. French.
-
Integration of isothermal amplification methods in microfluidic devices: Recent advances.Biosens Bioelectron. 2017 Apr 15;90:174-186. doi: 10.1016/j.bios.2016.11.045. Epub 2016 Nov 19. Biosens Bioelectron. 2017. PMID: 27888686 Review.
Cited by
-
The Future of Digital Polymerase Chain Reaction in Virology.Mol Diagn Ther. 2016 Oct;20(5):437-47. doi: 10.1007/s40291-016-0224-1. Mol Diagn Ther. 2016. PMID: 27351921 Review.
-
Comparison of droplet digital PCR to real-time PCR for quantitative detection of cytomegalovirus.J Clin Microbiol. 2013 Feb;51(2):540-6. doi: 10.1128/JCM.02620-12. Epub 2012 Dec 5. J Clin Microbiol. 2013. PMID: 23224089 Free PMC article.
-
A portable droplet generation system for ultra-wide dynamic range digital PCR based on a vibrating sharp-tip capillary.Biosens Bioelectron. 2021 Nov 1;191:113458. doi: 10.1016/j.bios.2021.113458. Epub 2021 Jun 24. Biosens Bioelectron. 2021. PMID: 34216876 Free PMC article.
-
Multiplex digital profiling of DNA methylation heterogeneity for sensitive and cost-effective cancer detection in low-volume liquid biopsies.Sci Adv. 2024 Nov 22;10(47):eadp1704. doi: 10.1126/sciadv.adp1704. Epub 2024 Nov 22. Sci Adv. 2024. PMID: 39576863 Free PMC article.
-
Mechanistic evaluation of the pros and cons of digital RT-LAMP for HIV-1 viral load quantification on a microfluidic device and improved efficiency via a two-step digital protocol.Anal Chem. 2013 Feb 5;85(3):1540-6. doi: 10.1021/ac3037206. Epub 2013 Jan 16. Anal Chem. 2013. PMID: 23324061 Free PMC article.
References
-
- Brambilla D, Reichelderfer PS, Bremer JW, Shapiro DE, Hershow RC, Katzenstein DA, Hammer SM, Jackson B, Collier AC, Sperling RS, Fowler MG, Coombs RW. AIDS. 1999;13:2269–2279. - PubMed
-
- Calmy A, Ford N, Hirschel B, Reynolds SJ, Lynen L, Goemaere E, de la Vega FG, Perrin L, Rodriguez W. Clin Infect Dis. 2007;44:128–134. - PubMed
Publication types
MeSH terms
Substances
Grants and funding
LinkOut - more resources
Full Text Sources
Other Literature Sources
