. 2011 Oct 7;44(1):134-46.
doi: 10.1016/j.molcel.2011.06.038.

p62 is a key regulator of nutrient sensing in the mTORC1 pathway

Affiliations

p62 is a key regulator of nutrient sensing in the mTORC1 pathway

Angeles Duran et al. Mol Cell. .

Abstract

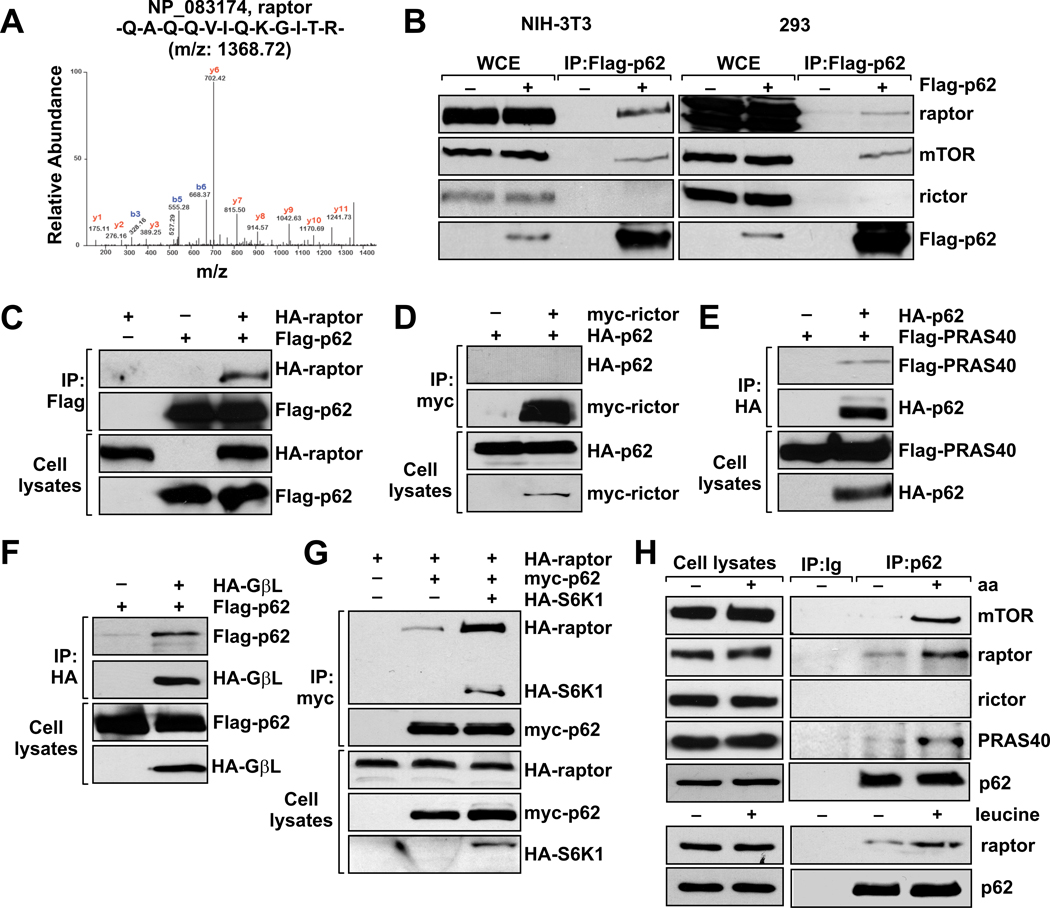
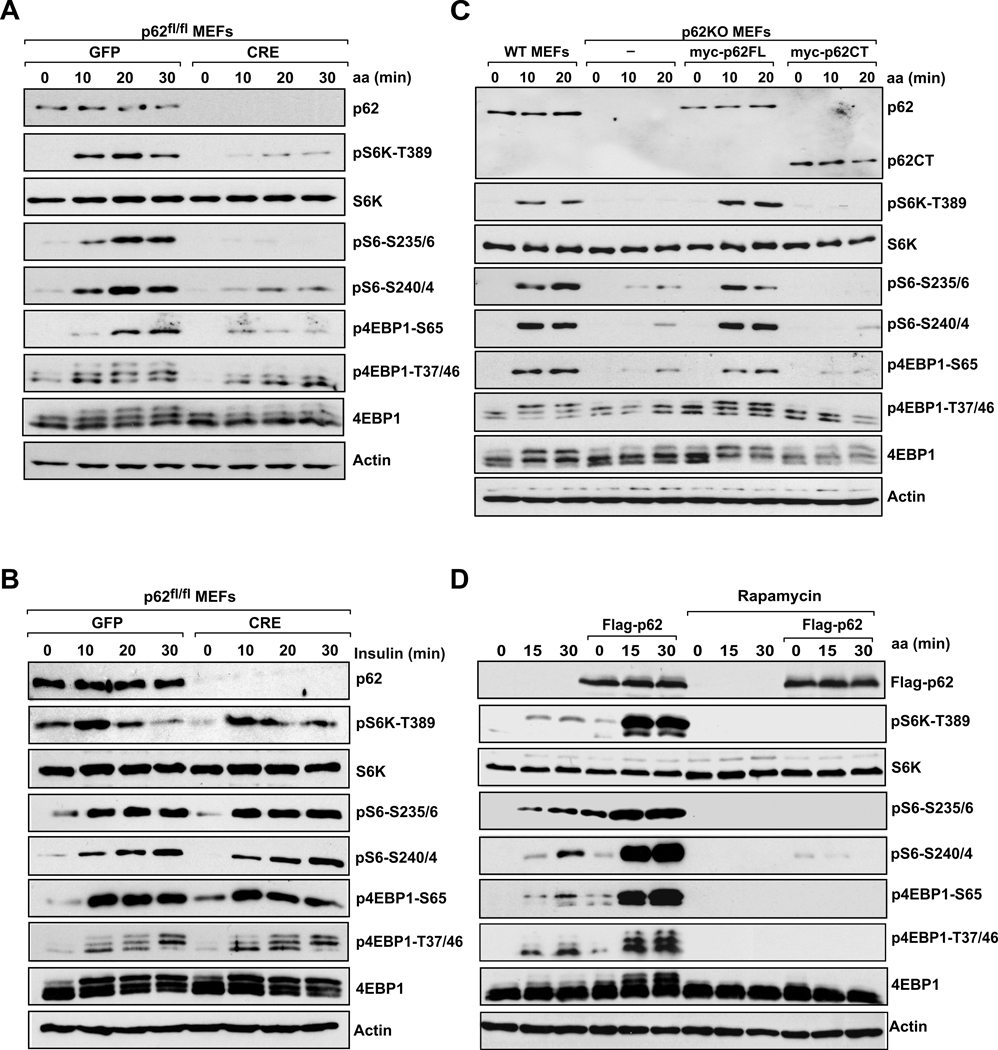
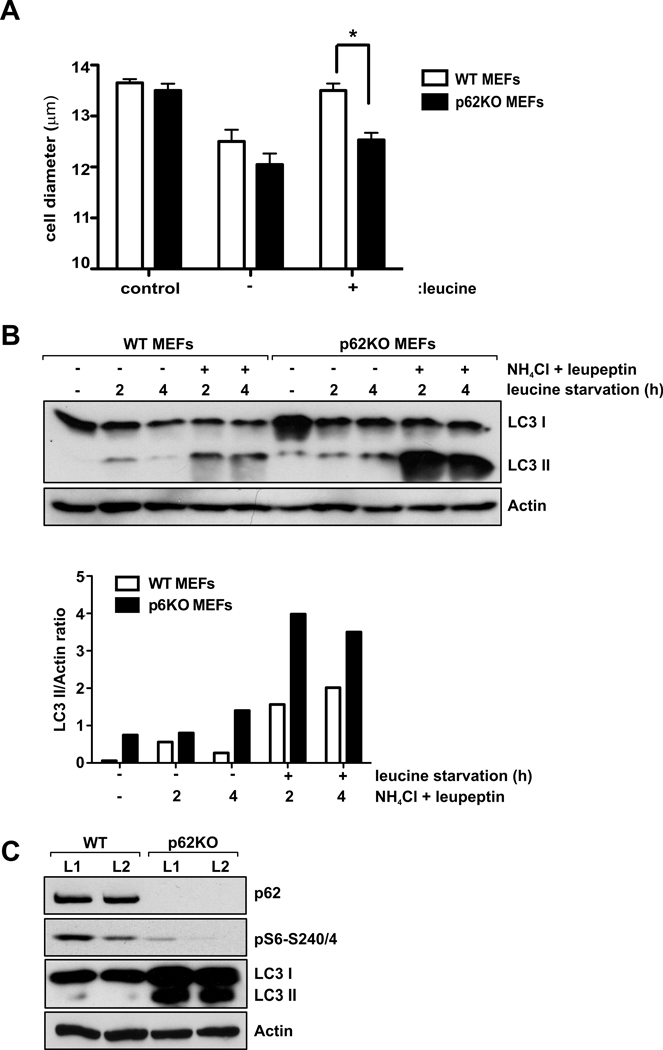
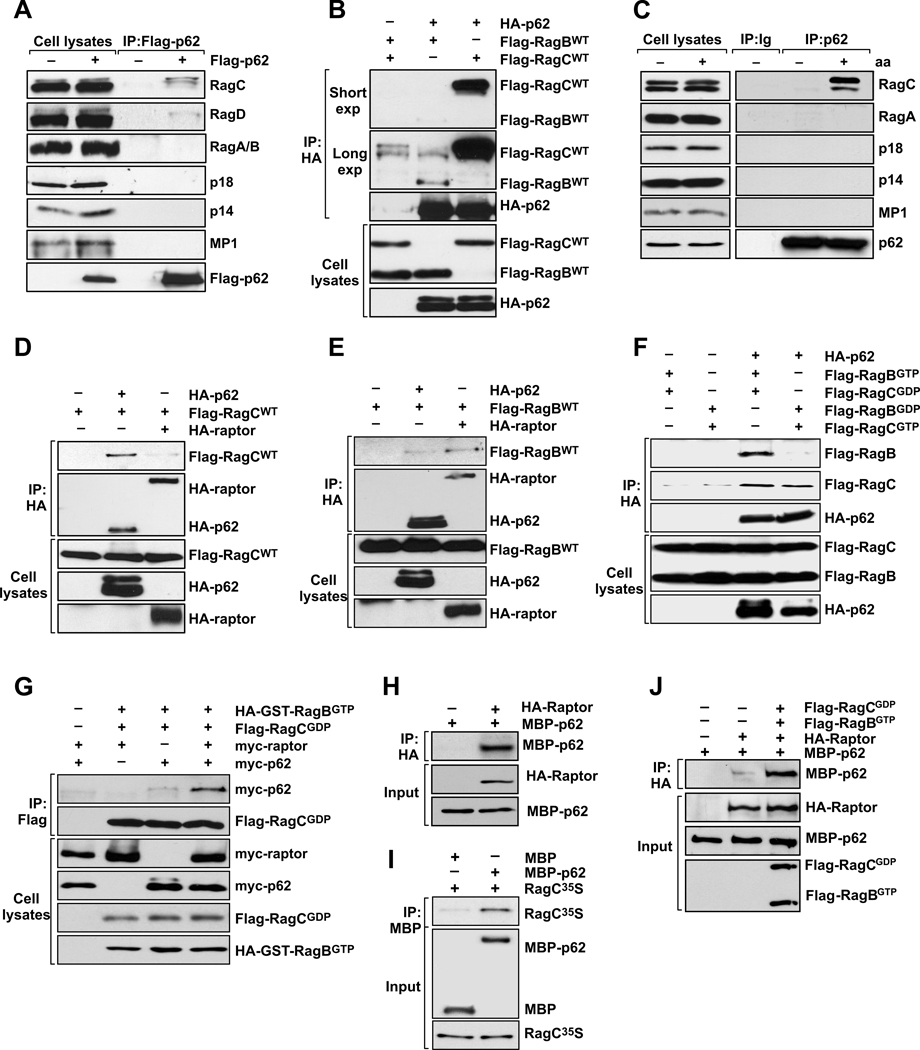
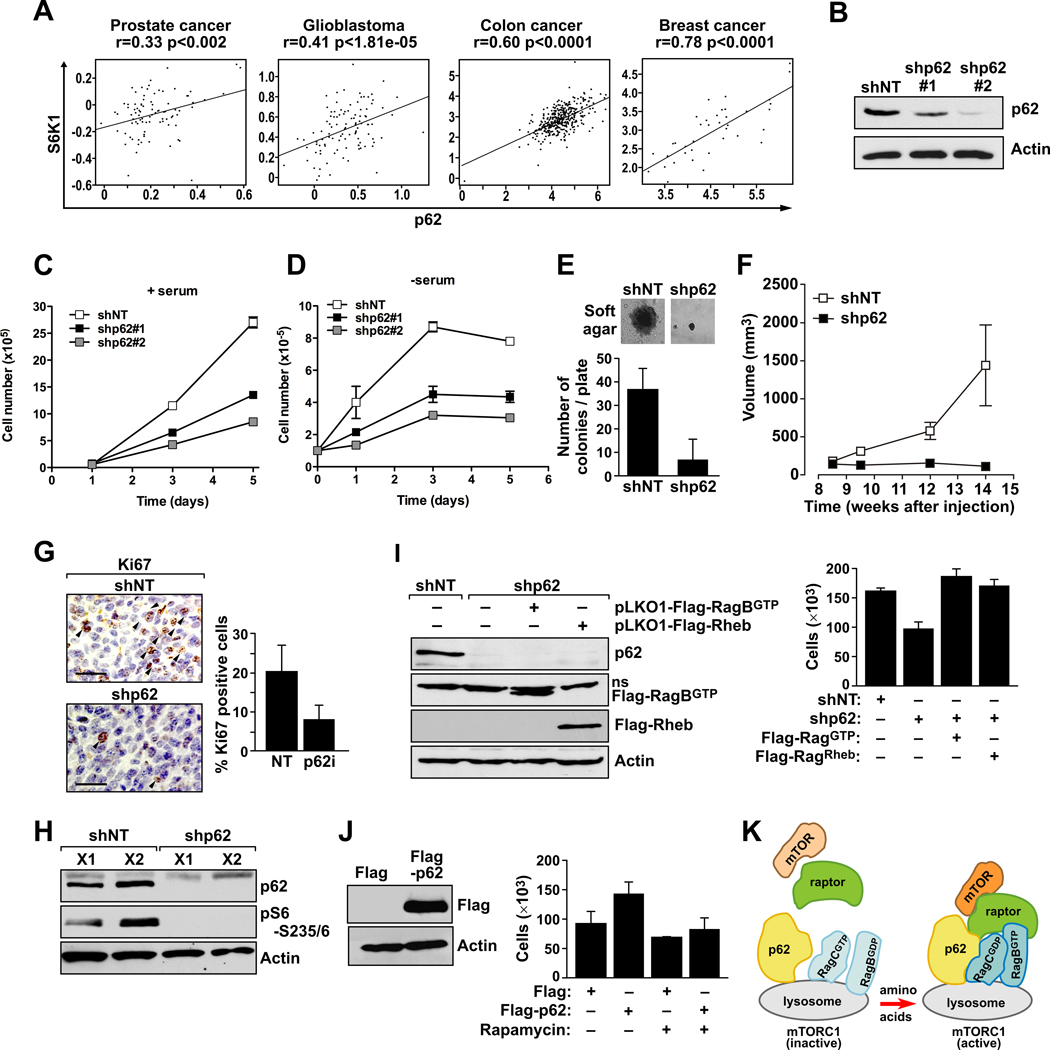
The signaling adaptor p62 is a critical mediator of important cellular functions, owing to its ability to establish interactions with various signaling intermediaries. Here, we identify raptor as an interacting partner of p62. Thus, p62 is an integral part of the mTORC1 complex and is necessary to mediate amino acid signaling for the activation of S6K1 and 4EBP1. p62 interacts in an amino acid-dependent manner with mTOR and raptor. In addition, p62 binds the Rags proteins and favors formation of the active Rag heterodimer that is further stabilized by raptor. Interestingly, p62 colocalizes with Rags at the lysosomal compartment and is required for the interaction of mTOR with Rag GTPases in vivo and for translocation of the mTORC1 complex to the lysosome, a crucial step for mTOR activation.


Figures

Figure 1
Figure 1. p62 interacts with Raptor and components of the mTORC1 complex, but not of mTORC2
(A) LC/MS/MS spectra of the purified Flag-p62 peptides corresponding to raptor from NIH-3T3 cells stably expressing Flag-p62. (B) Lysates and Flag immunoprecipitates from NIH-3T3 and 293 cells stably expressing Flag-p62 were analyzed to detect the indicated proteins. In (C) through (G) 293 cells were transfected with the indicated cDNAs in expression vectors, cell lysates were prepared, and lysates and HA-, Flag-, or myc-tagged immunoprecipitates were analyzed by immunoblotting to quantify the specified ectopic proteins. (H) Endogenous interaction of p62 with components of the mTOR signaling pathway in response to amino acids or leucine. Cell lysates and p62 immunoprecipitates from amino acid- or leucine-treated HEK293T cells were analyzed for the levels of specified proteins. These results are representative of three experiments.
Figure 2
Figure 2. p62 is essential for mTORC1 activation in response to amino acids
Effects of p62 depletion on activation of the mTORC1 pathway in response to (A) amino acids or (B) insulin. p62fl/fl MEFs were infected with GFP or CRE adenoviruses, and then stimulated with amino acids or insulin. Lysates were analyzed for levels of the specified proteins. (C) WT and p62KO MEFs, reconstituted with p62FL or p62CT, were treated as described in (A). Cell lysates were prepared and analyzed by immunoblotting for the levels of the indicated proteins. (D) 293 cells stably expressing Flag-p62 were deprived of amino acids and serum for 50 min, pretreated with rapamycin for 30 min, and then stimulated with amino acids for the indicated durations. Cell lysates were analyzed for the levels of the specified proteins. These results are representative of three experiments.
Figure 3
Figure 3. p62 regulates cell size and autophagy
(A) Cell size was determined in WT and p62KO MEFs deprived of leucine for 24 h and re-stimulated with leucine for 24 h. Error bars specify the standard deviation between three independently performed experiments. *p<0.05. (B) WT and p62KO MEFs were deprived of leucine and serum for 2 and 4 hours in the absence or presence NH4Cl and leupeptin. Cell lysates were analyzed for the levels of the specified proteins. Graphs represent the densitometric LC3-II/actin ratios. (C) Protein extracts from livers of 24h fasted WT and p62KO mice were analyzed for the levels of the specified proteins. These results are representative of three experiments.
Figure 4
Figure 4. Amino acid-induced regulation of the p62-Rag complex
(A) Cell lysates and Flag-p62 immunoprecipitates from NIH-3T3 cells stably expressing Flag-p62 were analyzed by immunoblotting to determine levels of the specified proteins. (B) p62 preferentially binds to RagC. 293 cells were transfected with the indicated cDNAs in expression vectors, cell lysates were prepared, and lysates and HA- or Flag-tagged immunoprecipitates were analyzed by immunoblotting to determine amounts of the specified ectopic proteins. (C) Endogenous interaction of p62 with Rags and components of Ragulator in response to amino acids. Cell lysates and p62 immunoprecipitates from amino acid-treated 293 cells were analyzed for the levels of specified proteins. In (D) to (G), 293 cells were transfected with the indicated cDNAs in expression vectors, cell lysates were prepared, and lysates and HA- or Flag-tagged immunoprecipitates were analyzed by immunoblotting to determine amounts of the specified ectopic proteins. (H) Recombinant MBP-p62 was incubated with HA-raptor purified from HEK293T cells, and the ability of raptor to bind directly to p62 was determined in pulldown experiments employing HA beads. (I) In vitro translated RagC was incubated with MBP or MBP-p62 and its ability to bind directly to p62 was determined in pulldown experiments employing amylose beads. (J) Recombinant MBP-p62 was incubated with HA-raptor purified from HEK293T cells, in the absence or presence of RagBGTP or RagCGDP, and the ability of raptor to bind directly to p62 was determined in pulldown experiments employing HA beads. These results are representative of three experiments.
Figure 5
Figure 5. p62 promotes formation of the active Rag heterodimer
(A) p62 stabilizes the Rag heterodimer. HEK293T cells were transfected with the indicated cDNAs in expression vectors, cell lysates were prepared, and lysates and Flag-tagged immunoprecipitates were analyzed by immunoblotting to detect the specified ectopic proteins. The graph shows a quantification of the RagB/C dimer formation. Results are represented as means ± standard deviations of three different experiments. *p<0.05. (B) p62 immunoprecipitates from 293 cells, infected with lentiviral shRNA for RagC or RagD, or non-targeting (NT) shRNA, were analyzed by immunoblotting to determine levels of the specified proteins. (C) Cell lysates and RagC immunoprecipitates from WT and p62 KO immortal MEFs reconstituted with p62FL or p62CT were analyzed by immunoblotting to determine levels of specified proteins. (D) Effects of p62 on GTP loading of RagB. The percentage of GTP bound to RagB is indicated for each sample. A portion of cell lysate was taken before immunoprecipitation to probe for expression. (E) p62fl/fl MEFs, infected with GFP or CRE adenovirus, were transfected with Flag-RagBGTP and RagCGDP. Cells were starved for 4 h and restimulated with amino acids for 10 min. Cell lysates were analyzed by immunoblotting to determine levels of the specified proteins. These results are representative of three experiments.
Figure 6
Figure 6. p62 regulates mTOR translocation to the lysosomal compartment
Starved or restimulated 293 cells were co-immunostained for p62 and (A) LAMP2, (B) RagC, (C) mTOR, or (D) raptor. (E) p62fl/fl MEFs infected with GFP or CRE adenovirus and overexpressing activated RagB were starved for 4 h and then restimulated with amino acids for 10 min. Afterwards, they were co-immunostained for mTOR and LAMP2. (F) Images of WT and p62 KO immortal MEFs co-immunostained for RagC and LAMP2. In all images, inserts show selected fields that were magnified two or five times to show areas of staining overlap (Merge). Scale bars=10 µm. Images are representative of three experiments.
Figure 7
Figure 7. p62 drives tumorigenesis through activation of the mTORC1 pathway
(A) Positive correlation between p62 and S6K1 mRNA levels in human cancers. (B) Cap2 cells were infected with lentiviral shRNAs including non-targeting shRNA (shNT), and two different lentiviral shRNAs for p62 (shp62#1 and shp62#2). After selection with puromycin, levels of p62 were analyzed by immunoblot. (C) Growth curve of shNT and shp62 cells under normal growing conditions or (D) in the absence of serum. Results are shown as means ± standard deviations. (E) Soft-agar growth of shNT and shp62 Cap2 cells, and quantification of the number of colonies at 21 days. The experiment shown in panel E is representative of another two with similar results. The graph in panel E shows means ± standard deviations. (F) Suspensions of shNT and shp62 Cap2 cells, as described in (B), were intradermally injected into each flank of nude mice, and tumors were allowed to develop for 15 days. Tumor size was measured twice per week. Results are means ± standard deviations (n = 5). (G) Immunohistochemical analysis of Ki67 expression in shNT and shp62 Cap2 cell xenografts (left). Graph shows the quantitation of Ki67-positive cells in these tumors (right). Results are the means ± standard deviations of counts from 10 different fields per mouse, with a total of 5 mice per condition. (H) Cell lysates from these tumors (X1 and X2) were analyzed by immunoblotting to determine amounts of the specified proteins. (I) Stably expressing Flag-RagBGTP or Flag-Rheb prostate cancer cells were infected with shNT or shp62 lentiviral vectors. Cell lysates were analyzed by immunoblotting to determine levels of specified proteins (left). Cell viability was determined at 3 days after serum withdrawal (right). Results are shown as means ± standard deviations. (J) Stably expressing Flag-p62 cells were analyzed by immunoblotting to determine levels of the specified proteins (left). Cell viability was determined at 3 days after serum withdrawal (right) in the presence or absence of rapamycin. Results are shown as means ± standard deviations. (K) Model for the role of p62 in amino acid signaling towards mTORC1 activation.

Comment in

References

    1. Duran A, Linares JF, Galvez AS, Wikenheiser K, Flores JM, Diaz-Meco MT, Moscat J. The signaling adaptor p62 is an important NF-kappaB mediator in tumorigenesis. Cancer Cell. 2008;13:343–354. - PubMed
    1. Duran A, Serrano M, Leitges M, Flores JM, Picard S, Brown JP, Moscat J, Diaz-Meco MT. The atypical PKC-interacting protein p62 is an important mediator of RANK-activated osteoclastogenesis. Dev Cell. 2004;6:303–309. - PubMed
    1. Fingar DC, Salama S, Tsou C, Harlow E, Blenis J. Mammalian cell size is controlled by mTOR and its downstream targets S6K1 and 4EBP1/eIF4E. Genes Dev. 2002;16:1472–1487. - PMC - PubMed
    1. Guertin DA, Sabatini DM. Defining the role of mTOR in cancer. Cancer Cell. 2007;12:9–22. - PubMed
    1. Hansen M, Chandra A, Mitic LL, Onken B, Driscoll M, Kenyon C. A role for autophagy in the extension of lifespan by dietary restriction in C. elegans. PLoS genetics. 2008;4:e24. - PMC - PubMed

Publication types

MeSH terms