. 2011 Oct 14;147(2):332-43.
doi: 10.1016/j.cell.2011.08.049. Epub 2011 Oct 6.

Two forms of loops generate the chromatin conformation of the immunoglobulin heavy-chain gene locus

Affiliations

Two forms of loops generate the chromatin conformation of the immunoglobulin heavy-chain gene locus

Changying Guo et al. Cell. .

Abstract

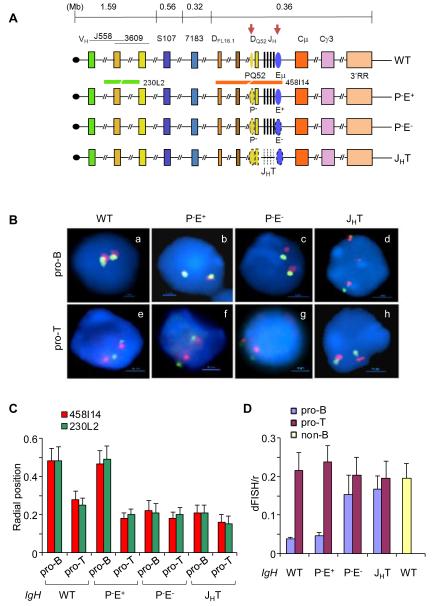
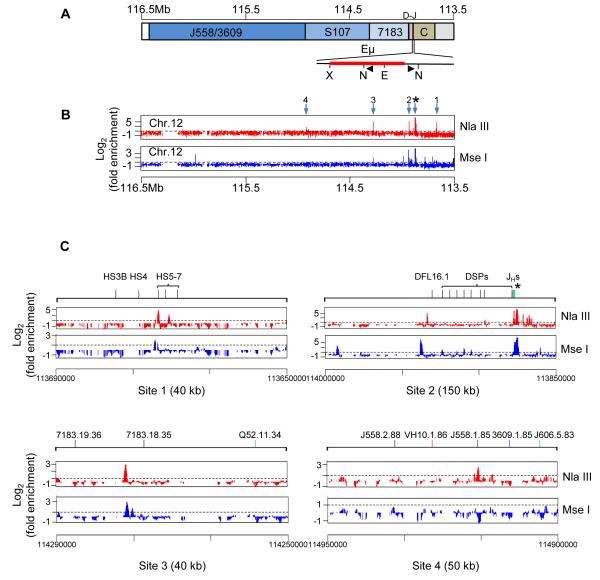
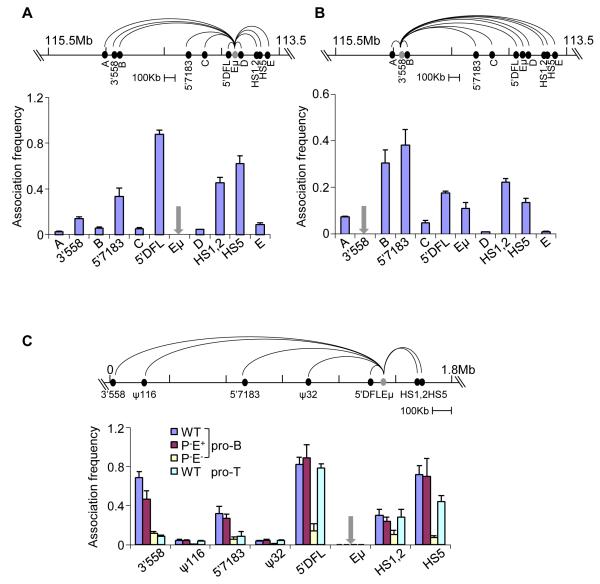
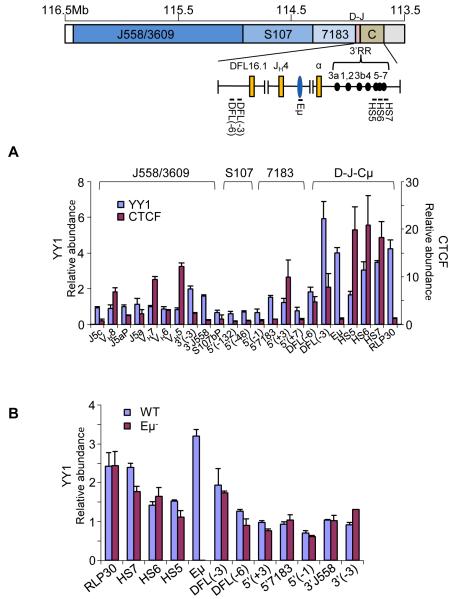
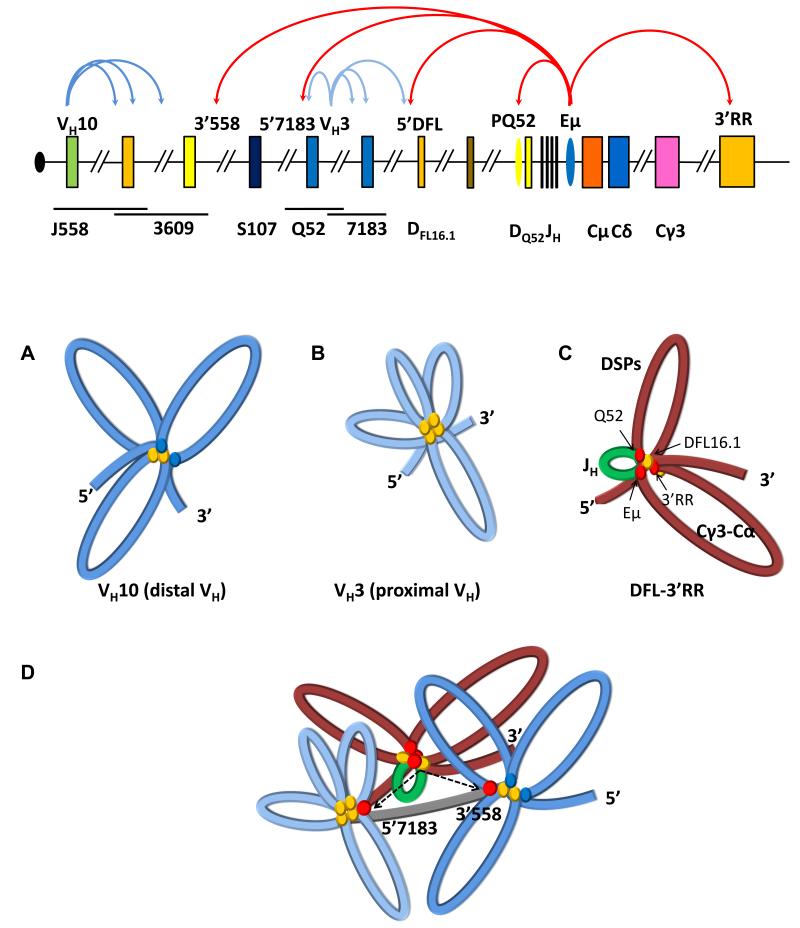
The immunoglobulin heavy-chain (IgH) gene locus undergoes radial repositioning within the nucleus and locus contraction in preparation for gene recombination. We demonstrate that IgH locus conformation involves two levels of chromosomal compaction. At the first level, the locus folds into several multilooped domains. One such domain at the 3' end of the locus requires an enhancer, Eμ; two other domains at the 5' end are Eμ independent. At the second level, these domains are brought into spatial proximity by Eμ-dependent interactions with specific sites within the V(H) region. Eμ is also required for radial repositioning of IgH alleles, indicating its essential role in large-scale chromosomal movements in developing lymphocytes. Our observations provide a comprehensive view of the conformation of IgH alleles in pro-B cells and the mechanisms by which it is established.


Figures

Figure 1
Figure 1. Nuclear positioning and locus contraction of IgH alleles with cis-regulatory sequence deletions
(A) Top line is a schematic representation of the murine IgH locus. Approximate distances between regions of interest are derived from the sequence of the locus in C57BL6 mouse strain (Johnston et al., 2006). The telomere (black circle)-proximal variable region (VH) spans approximately 2.5Mb and contains 150 VH segments. Gene segments corresponding to J558 and 3609 families are largely interspersed at the 5′ end. The 7183 family lies at the 3′ end of the cluster. The 5′-most and 3′-most diversity (DH) gene segments, DFL16.1 and DQ52, are indicated; between them lie variable numbers of DSP gene segments depending on the mouse strain. JH gene segments are depicted as black vertical lines. Two cis-regulatory elements discussed here, PQ52 and Eμ, are indicated as ovals and are marked by tissue-specific DNase I hypersensitive sites (red arrows). The region containing exons of various IgH isotypes span another 200 kb and is followed by a cluster of DNase I hypersensitive sites that comprise the 3′ regulatory region (3′RR). Next three lines show IgH alleles that carry deletions of specific regulatory sequences (shown by dotted lines) as indicated; IgH genotype notations used in the text are noted on the right. Red and green lines below the WT allele show the position of BAC probes used in FISH analyses. (B) Two-color FISH using bone marrow pro-B cells (a-d) and thymocytes (e-h) that carry wild-type (WT) or mutated IgH alleles as indicated. BAC probes are indicated in (A) and blue color marks nuclear DNA with DAPI. A representative nucleus from each genotype is shown. (C) Radial positioning of WT and mutated IgH alleles was determined by measuring the distance of red and green FISH signals from the nuclear boundary in approximately 200 nuclei from pro-B cells and thymocytes of the indicated IgH genotypes. Y axis shows the distance between FISH signals and the nuclear periphery divided by the nuclear radius. Error bars represent the standard deviation between nuclei. The percentage of IgH alleles close to the nuclear periphery in each genotype is shown in Figure S1. (D) Locus contraction of WT and mutated IgH alleles was estimated by measuring the distance between red and green FISH signals in approximately 200 nuclei. Y axis shows the distance between FISH signals divided by the nuclear radius. B lineage-depleted bone marrow cells from RAG2-deficient mice were used as non-B controls. Error bars represent the standard deviation between nuclei. Measurements were made with three independent cell preparations each obtained from 5-6 mice of the indicated genotypes.
Figure 2
Figure 2. Eμ-mediated long-range chromatin interactions in the IgH locus
(A) Schematic representation of the unrearranged IgH locus oriented with the DH-Cμ region on the right and VH region on the left. The region surrounding Eμ is expanded below to show the positions of restriction enzyme sites (N=Nla III; X= Xba I; E=EcoR I) and bait primers (black triangles) used in 4C assays. (B) 4C was carried out as described in the Experimental Procedures section using D345, a recombinase-deficient Abelson virus transformed pro-B cell line of C57BL6 origin. Position of bait primers close to Eμ is marked by the asterisk. Genomic sequences that were ligated between the Nla III sites (top panel) or Mse I sites (bottom panel) were amplified by PCR using the bait primers and hybridized to Affymetrix Genomic tiling 2.0R E array. Hybridization signal intensity was compared to input DNA in CisGenome and fold enrichment (Y axis) calculated as described in Experimental Procedures. Numbered arrows mark enriched regions. 1 corresponds to the HS5 region of the 3′RR, 2 corresponds to sequences 5′ of DFL16.1 (5′DFL in text), 3 corresponds to sequence referred to as 5′7183 in the text and 4 corresponds to sequence referred to as 3′558 in the text. One of two independent experiments with each restriction enzyme is shown; high resolution 4C data is shown in Figure S2A, B. 4C analysis with 5′7183 anchor is shown in Figure S2C. (C) Expanded views of 4C results of the regions near each of the numbered Eμ- interacting sites in part B. The extent of each expanded region is noted in parentheses; further high resolution 4C data is shown in Figure S2A. 4C analysis with 5′7183 anchor is shown in Figure S2B.
Figure 3
Figure 3. 3C analyses of Eμ-interacting regions
Quantitative 3C analyses in D345 pro-B cells using different anchors (grey) as indicated. Taqman probes for detection of amplicons were located close to the anchor primers. Data with Eμ (A) and 3′558 (B) anchor primers are shown (additional 3C studies with 5′7183 and HS5 anchors are in Figure S3A and B). Association frequency (Y axis) between two primers was normalized to long-range 3′HS1 interaction in the ß-globin locus; grey arrows mark the site of anchor primers in the bar graphs. Data shown is the average of three independent 3C experiments, with error bars representing the standard error of mean between experiments. (C) Quantitative 3C analyses using primary bone marrow pro-B cells and thymocytes that carry IgH alleles of the indicated genotypes (all cells were obtained from RAG2-deficient background). Coordinates of the IgH locus in the 129 strain (Simpson et al., 1997) are shown on the top line with positions of the relevant sequences identified by 4C. 3C assays were carried out using anchor primer was used in combination with primers located near HS1,2, HS5, 5′DFL, 5′7183 and 3′558; the ψ116 and ψ32 sequences served as negative controls. Amplification products were detected using a Taqman probe located close to the Eμ anchor primer. The association frequency (Y axis) between two primers was normalized to long-range 3′HS1 interaction in the ß-globin locus (Figure S3C). Data shown is the average of three independent 3C experiments in each genotype; error bars represent the standard error of mean between experiments.
Figure 4
Figure 4. Visualization of Eμ-dependent locus contraction
(A) The unrearranged IgH locus as represented in Figure 2A showing the location of six 10 kb probes used for FISH. (B) Three color 3D-FISH were carried out with bone marrow pro-B cells of the indicated IgH genotypes cells in a RAG2-deficient background. Short probes labeled with Alexa Fluor 594 (red) and 488 (green), and BAC RP23-201H14 labeled with Alexa Fluor 697 (blue) were hybridized to fixed pro-B cells. Signals were visualized by epifluorescence microscopy and distances between probes were determined as described (Jhunjhunwala et al., 2008) and shown in Table S1. Probe combinations were: a, d, g h4-red, h11-green; b, e, h h4-red, 5′7183-green; c, f, i h4-green, 3′558-red. Red line represents 1 μm. (C) Quantitation of FISH data shown in part B. Distances between red and green 3D FISH signals in part A were divided into 5 categories (<0.2, 0.2-0.5, 0.5-0.8, 0.8-1.0, and >1.0 μm) for 60-90 nuclei. The percentage of IgH alleles in each category was determined (Y axis) for each IgH genotype (X axis) and is represented in different colors. Probe combinations are shown above the bars. Pro-B cells were purified from 5-6 mice of each genotype. (D) Three color 3D-FISH with RAG2-deficient pro-B cell lines carrying WT and Eμ- deleted IgH alleles. Probe combinations were: a, c h4-red, h11-green; b, d h4-green, 3′558-red. (E) Quantitation of the FISH data shown in part D as described in C. (F) Three color 3D-FISH with bone marrow pro-B cells of the indicated IgH genotypes cells obtained from RAG2-deficient background. Probe combinations were: a, c h1-red, h11-green; b, d DFL-red, 3′RR-green. Pro-B cells were purified from 5-6 mice of each genotype. (G) Quantitation of FISH data shown in part F as described in C.
Figure 5
Figure 5. Interaction of YY1 with Eμ-interacting sequences
(A) Chromatin immunoprecipitations were carried out with anti-YY1 and anti-CTCF antibodies using D345 pro-B cells. ChIP primers from the 3′ region of the IgH locus used are shown on the top line. VH primers assay gene families noted above the bar graph. The relative abundance of specific amplicons in the immunoprecipitate compared to input DNA is shown on the Y axis. Y axis scales differ for YY1 ChIP (left) and CTCF ChIP (right). RPL30 is a positive control for YY1 binding (Liu et al., 2007). HS5-7 correspond to amplicons located within these DNase I hypersensitive sites in the 3′RR, DFL(-3) and DFL(-6) amplicons are located 3 and 6 kb 5′ of DFL16.1, amplicons near 5′7183 and 3′558 are indicated. Data shown is the average of three independent ChIP experiments with each antibody; error bars represent the standard deviation between experiments. See also Figure S4. (B) Chromatin immunoprecipitation was carried out with anti-YY1 antibody using RAG2-deficient pro-B cell lines carrying WT and Eμ IgH alleles. Amplicons are as noted in part A. Error bars represent the standard deviation between three independent experiments.
Figure 6
Figure 6. CTCF-containing loops in the IgH locus
(A) A schematic of the IgH locus as described in Figure 2A. J558/3609, S107 and 7183 refer to VH gene families. Triangles show positions of oppositely-oriented primers labeled VH3 and VH10 used in ChIP-loop and 4C assays. The nearest VH gene segment to these primers is indicated. (B) ChIP-loop 4C assays were performed using D345 pro-B cells. Cross-linked chromatin was immunoprecipitated with anti-CTCF antibodies, followed by digestion of the associated chromatin with Nla III. After re-ligation the DNA was amplified with VH3 or VH10 primers. Sequences amplified within VH3 primers (red trace) or VH10 primers (blue trace) were hybridized to Affymetrix chromosome 12 tiling arrays and quantitated as described in Experimental Procedures. Asterisk indicates position of anchor primers; labeled arrows indicate positions of sequences identified in the assay. Data shown is representative of two independent experiments with each anchor primer. (C) Conventional 4C assay using Nla III restriction enzyme was carried out using VH3 (red trace) or VH10 (blue trace) anchor primers. Asterisks mark the position of anchor primers; arrows indicate interacting regions shared between ChIP-loop and 4C arrays. (D) CTCF binding to sites identified by anti-CTCF ChIP-loop assays. Cross-linked chromatin from D345 cells was immunoprecipitated with anti-CTCF or anti-Rad21 antibodies. Co-precipitated genomic DNA was amplified with primers close to regions identified in ChIP-loop and 4C assays. VH1, 2, 3, VH3-1 to VH3-5 lie in the cluster of interacting sequences identified with VH3 primers. VH10-1 to VH10-4 correspond to interacting sequences identified with VH10 primers. VH3 and VH10 amplicons are close to the corresponding anchor primers used in 4C assays. CTCF binding to the 3′ DNase I hypersensitive site (3′HS1) in the β globin locus was used as the positive control. CTCF binding within the IgH locus is Eμ-independent (Figure S5A). Error bars represent the standard deviation between three independent experiments. (E) Top line shows the location of five short probes used in 3D FISH (see also Figure S5B). Three color 3D-FISH was carried out using bone marrow pro-B cells with wild type and PE IgH alleles on a RAG2-deficient background. Probes were labeled as follows: a and c, DFL-red, V3-green; b and d, V10-3-red, V10-green. Distances between probes were determined as described in Figure 4C and shown in Table S1. Right panels show quantitation of FISH data as described in Figure 4C, obtained from the analyses of 60-90 nuclei from 2 independent cell preparations. 3C analysis of V3-DFL loops in WT and Eμ pro-B cells is shown in Figure S5C, D.
Figure 7
Figure 7. Two levels of chromatin compaction at IgH alleles
Top line shows a schematic of the unrearranged IgH locus. For description, see Figure 1 legend. Regulatory sequences PQ52 and Eμ are indicated as ovals. Eμ-dependent and Eμ-independent chromatin loops identified in this study are shown as red and blue colored curved arrows, respectively. The first level of chromatin compaction involves the formation of multi-looped domains (middle panel). Three such domains were identified. Those in 5′ VH part of the locus near VH10 and VH3 (A and B, respectively), are Eμ- independent. The number of loops in each domain is inferred from the number of interaction sites as discussed in the text. CTCF binding is indicated by yellow ovals; possible role for factors other than CTCF at VH10 is indicated by blue ovals. At the 3′ end an Eμ-dependent domain (middle panel, part C) extends from sequences 5′ of DFL16.1 (5′DFL) to the 3′RR. A proposed three-loop configuration for this domain is discussed in the text. The smallest loop that contains the 4 JH gene segments and DQ52 is indicated in green because it has the highest levels of activating histone modifications, and binds RAG1 and RAG2 to form a recombination center (Ji et al., 2010). The two other loops that contain DSP gene segments and constant region exons (Cγ3-Cα) (shown in red) are marked with H3K9me2. Red ovals at the base of these loops represent the possible role of YY1 protein in establishing this domain. The second level of chromatin compaction involves the interaction of Eμ with specific sites in the VH region (panel D). We identified two such sites, 5′7183 and 3′558 (top line); both these interaction sites lie outside VH10- and VH3-associated domains, suggesting that the multi-looped structure within each domain does not change with these interactions. Rather Eμ-3′558 and Eμ- 5′7183 interactions bring these domains into the vicinity of the DFL-3′RR domain and, thereby, in physical proximity to the RAG-rich recombination center. Linker regions between identified domains are shown in grey.

References

    1. Afshar R, Pierce S, Bolland DJ, Corcoran A, Oltz EM. Regulation of IgH gene assembly: role of the intronic enhancer and 5′DQ52 region in targeting DHJH recombination. J Immunol. 2006;176:2439–2447. - PubMed
    1. Chakraborty T, Chowdhury D, Keyes A, Jani A, Subrahmanyam R, Ivanova I, Sen R. Repeat organization and epigenetic regulation of the DH-Cmu domain of the immunoglobulin heavy-chain gene locus. Mol Cell. 2007;27:842–850. - PubMed
    1. Chakraborty T, Perlot T, Subrahmanyam R, Jani A, Goff PH, Zhang Y, Ivanova I, Alt FW, Sen R. A 220-nucleotide deletion of the intronic enhancer reveals an epigenetic hierarchy in immunoglobulin heavy chain locus activation. J Exp Med. 2009;206:1019–1027. - PMC - PubMed
    1. Cook PR, Brazell IA, Jost E. Characterization of nuclear structures containing superhelical DNA. J Cell Sci. 1976;22:303–324. - PubMed
    1. Degner SC, Wong TP, Jankevicius G, Feeney AJ. Cutting edge: developmental stage-specific recruitment of cohesin to CTCF sites throughout immunoglobulin loci during B lymphocyte development. J Immunol. 2009;182:44–48. - PMC - PubMed

Publication types