

High dimensional endophenotype ranking in the search for major depression risk genes
- PMID: 21982424
- PMCID: PMC3230692
- DOI: 10.1016/j.biopsych.2011.08.022
High dimensional endophenotype ranking in the search for major depression risk genes
Abstract
Background: Despite overwhelming evidence that major depression is highly heritable, recent studies have localized only a single depression-related locus reaching genome-wide significance and have yet to identify a causal gene. Focusing on family-based studies of quantitative intermediate phenotypes or endophenotypes, in tandem with studies of unrelated individuals using categorical diagnoses, should improve the likelihood of identifying major depression genes. However, there is currently no empirically derived statistically rigorous method for selecting optimal endophentypes for mental illnesses. Here, we describe the endophenotype ranking value, a new objective index of the genetic utility of endophenotypes for any heritable illness.
Methods: Applying endophenotype ranking value analysis to a high-dimensional set of over 11,000 traits drawn from behavioral/neurocognitive, neuroanatomic, and transcriptomic phenotypic domains, we identified a set of objective endophenotypes for recurrent major depression in a sample of Mexican American individuals (n = 1122) from large randomly selected extended pedigrees.
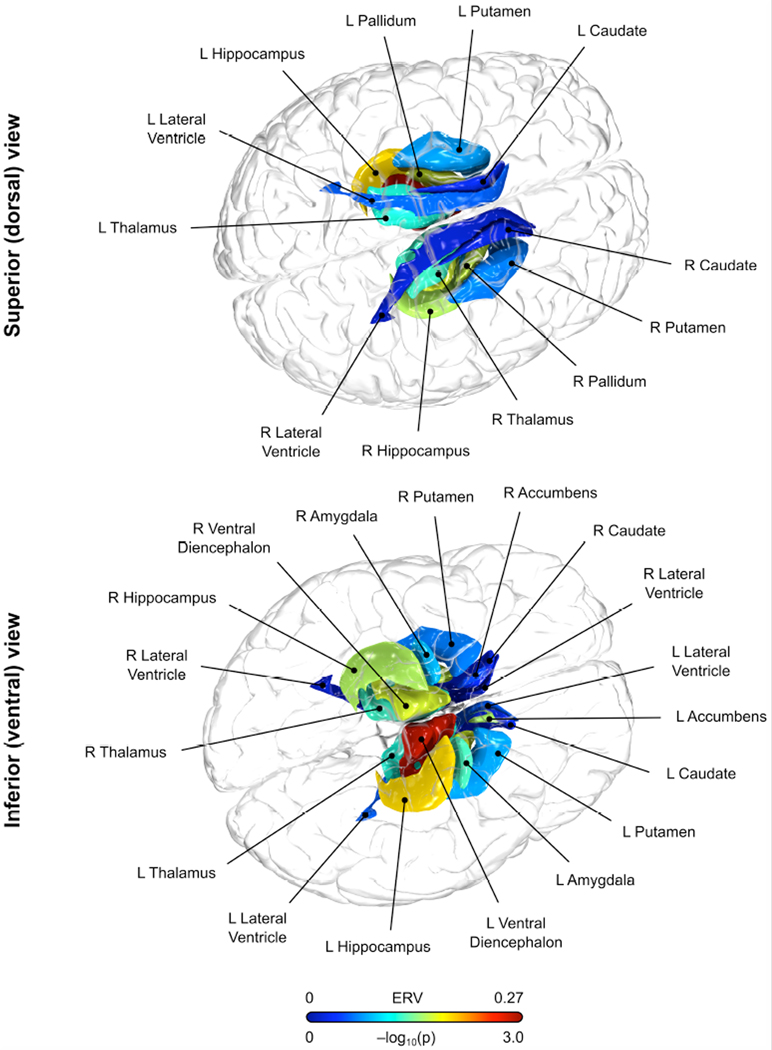
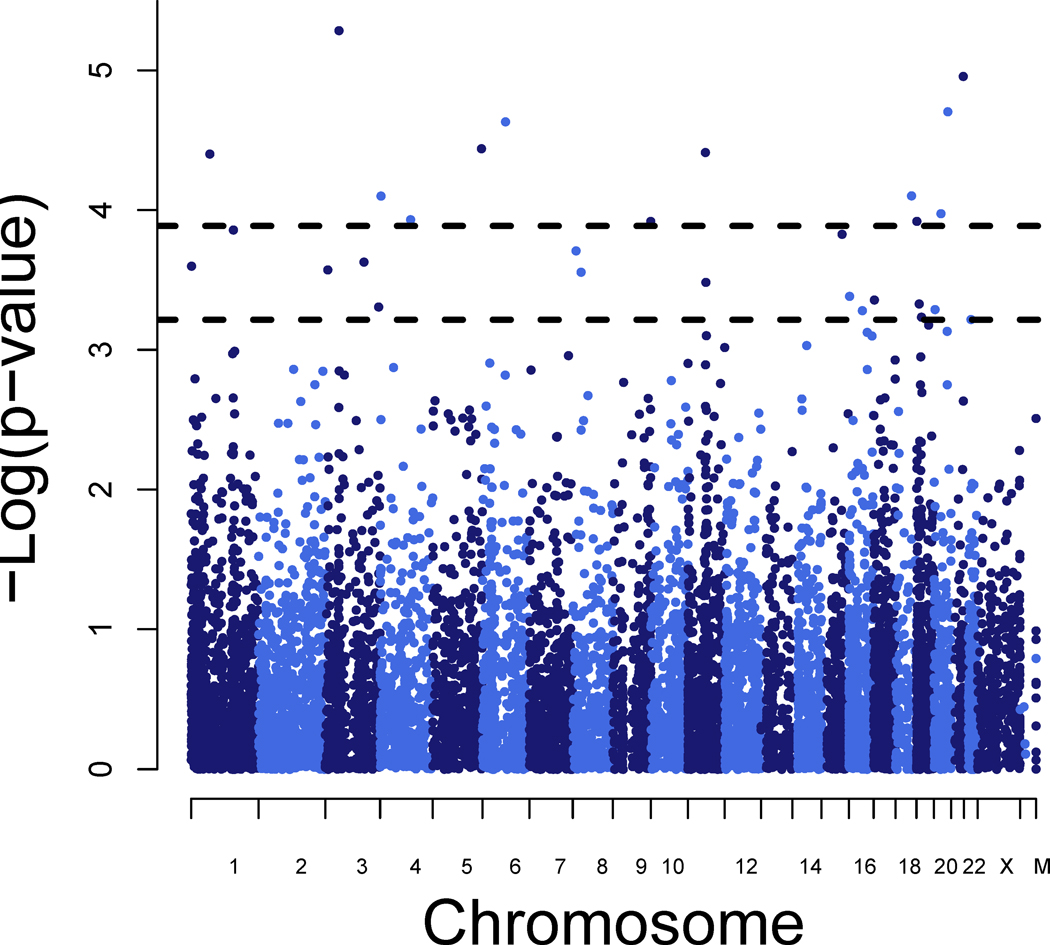
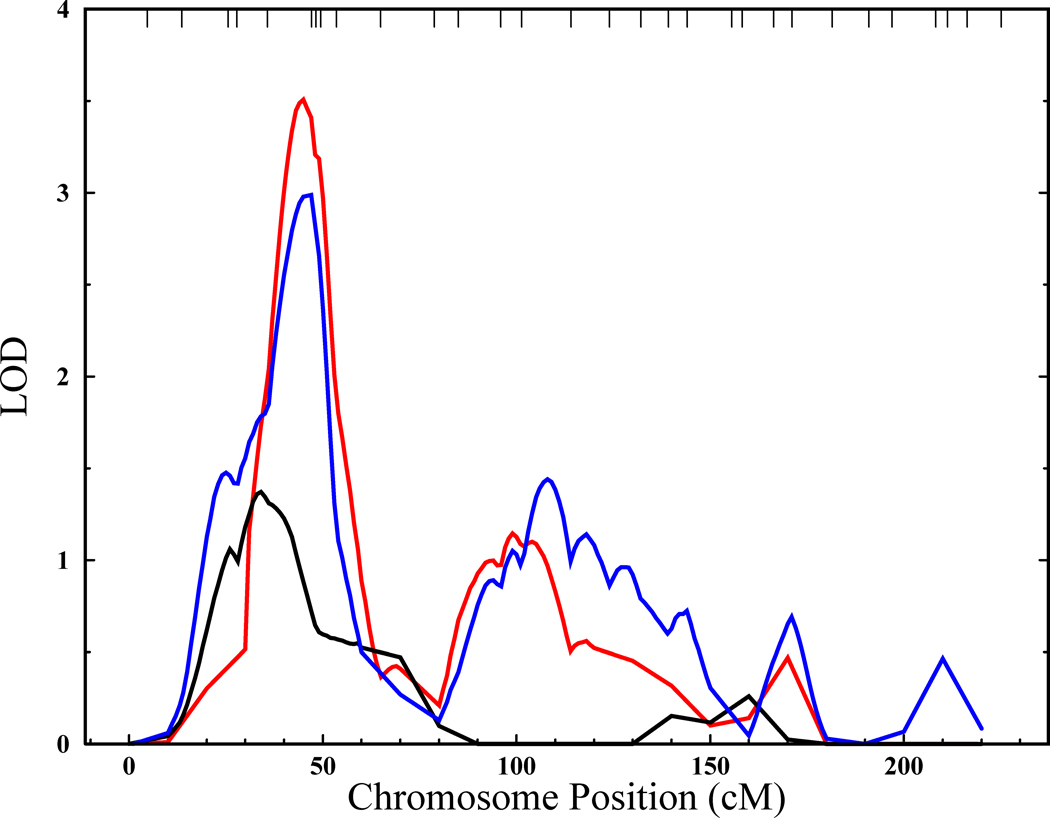
Results: Top-ranked endophenotypes included the Beck Depression Inventory, bilateral ventral diencephalon volume, and expression levels of the RNF123 transcript. To illustrate the utility of endophentypes in this context, each of these traits were utlized along with disease status in bivariate linkage analysis. A genome-wide significant quantitative trait locus was localized on chromsome 4p15 (logarithm of odds = 3.5) exhibiting pleiotropic effects on both the endophenotype (lymphocyte-derived expression levels of the RNF123 gene) and disease risk.
Conclusions: The wider use of quantitative endophenotypes, combined with unbiased methods for selecting among these measures, should spur new insights into the biological mechanisms that influence mental illnesses like major depression.
Copyright © 2012 Society of Biological Psychiatry. Published by Elsevier Inc. All rights reserved.
Conflict of interest statement
Figures
Comment in
-
Bringing genetics back to psychiatric endophenotypes.Biol Psychiatry. 2012 Jan 1;71(1):2-3. doi: 10.1016/j.biopsych.2011.10.033. Biol Psychiatry. 2012. PMID: 22137155 Free PMC article. No abstract available.
References
-
- Belmaker R, Agam G. Major depressive disorder. N Engl J Med. 2008;358:55–68. - PubMed
-
- Kessler R, Berglund P, Demler O, Jin R, Koretz D, Merikangas K, et al. The epidemiology of major depressive disorder: results from the National Comorbidity Survey Replication (NCS-R) JAMA. 2003;289:3095–3105. - PubMed
-
- McGuffin P, Katz R, Watkins S, Rutherford J. A hospital-based twin register of the heritability of DSM-IV unipolar depression. Arch Gen Psychiatry. 1996;53:129–136. - PubMed
-
- Sullivan P, Neale M, Kendler K. Genetic epidemiology of major depression: review and meta-analysis. Am J Psychiatry. 2000;157:1552–1562. - PubMed
Publication types
MeSH terms
Grants and funding
- S10 RR029392/RR/NCRR NIH HHS/United States
- MH083824/MH/NIMH NIH HHS/United States
- C06 RR017515/RR/NCRR NIH HHS/United States
- C06 RR013556/RR/NCRR NIH HHS/United States
- MH59490/MH/NIMH NIH HHS/United States
- R01 MH059490/MH/NIMH NIH HHS/United States
- R01 MH078143/MH/NIMH NIH HHS/United States
- R37 MH059490/MH/NIMH NIH HHS/United States
- R01 MH083824/MH/NIMH NIH HHS/United States
- MH078111/MH/NIMH NIH HHS/United States
- R01 MH080912/MH/NIMH NIH HHS/United States
- MH0708143/MH/NIMH NIH HHS/United States
- R01 MH078111/MH/NIMH NIH HHS/United States
- C06 RR13556/RR/NCRR NIH HHS/United States
LinkOut - more resources
Full Text Sources
