

Review
doi: 10.1016/j.cmet.2011.07.014.
Metabolic flux and the regulation of mammalian cell growth
Affiliations
- PMID: 21982705
- PMCID: PMC3196640
- DOI: 10.1016/j.cmet.2011.07.014
Item in Clipboard
Review
Metabolic flux and the regulation of mammalian cell growth
Cell Metab.
.
Abstract
The study of normal mammalian cell growth and the defects that contribute to disease pathogenesis links metabolism to cell growth. Here, we visit several aspects of growth-promoting metabolism, emphasizing recent advances in our understanding of how alterations in glucose metabolism affect cytosolic and mitochondrial redox potential and ATP generation. These alterations drive cell proliferation not only through supporting biosynthesis, energy metabolism, and maintaining redox potential but also through initiating signaling mechanisms that are still poorly characterized. The evolutionary basis of these additional layers of growth control is also discussed.
Copyright © 2011 Elsevier Inc. All rights reserved.
Figures
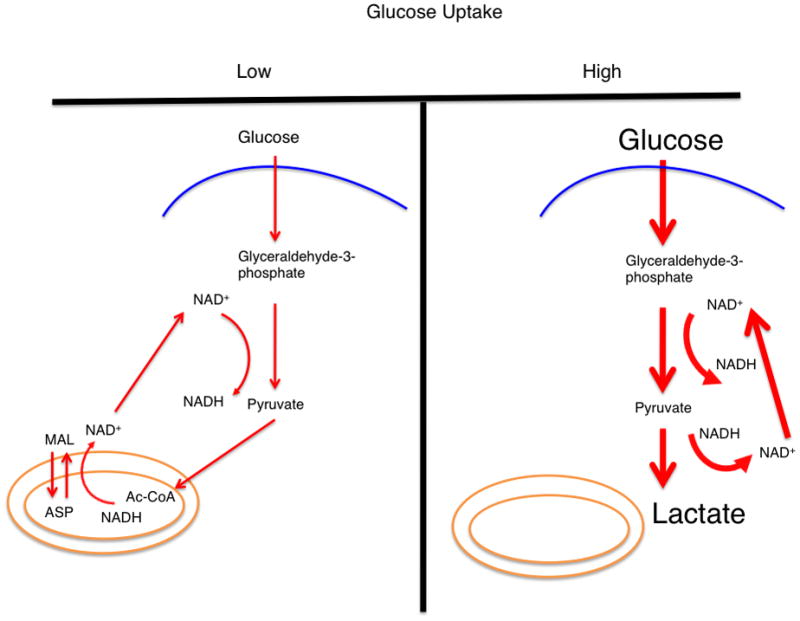
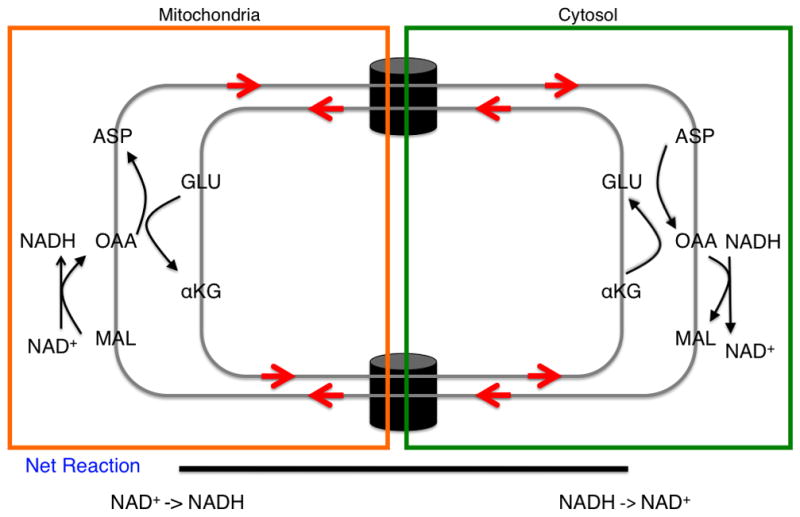
In conditions of low glucose uptake and flux through glycolysis (left), the glucose flux that passes through glycolysis and generates NADH is balanced by a mitochondrial shuttling mechanism. In conditions of high glucose uptake and flux (right), the capacity of the malate-aspartate shuttle to regenerate NAD+ can be saturated and lactate dehydrogenase activity is required to regenerate NAD+. A proposition is that this behavior can explain the Warburg effect. The thickness of the arrows represents relative magnitudes of flux at different points in the glycolytic pathway. (inset) The malate-aspartate shuttle: a series of oxidation-reduction reactions and anti-porter based trafficking of intermediate metabolites that begins with the oxidation of malate and end with reduction of aspartate in a series of six reactions. Directed arrows denote the conversion of substrate to product. The net result is a regeneration of NAD+ in the cytosol and production of NADH in the mitochondria. Abbreviations: MAL – malate, ASP – aspartate, αKG – alpha-ketoglutarate, OAA – oxaloacetate, and GLU – glutamate.
In conditions of low glucose uptake and flux through glycolysis (left), the glucose flux that passes through glycolysis and generates NADH is balanced by a mitochondrial shuttling mechanism. In conditions of high glucose uptake and flux (right), the capacity of the malate-aspartate shuttle to regenerate NAD+ can be saturated and lactate dehydrogenase activity is required to regenerate NAD+. A proposition is that this behavior can explain the Warburg effect. The thickness of the arrows represents relative magnitudes of flux at different points in the glycolytic pathway. (inset) The malate-aspartate shuttle: a series of oxidation-reduction reactions and anti-porter based trafficking of intermediate metabolites that begins with the oxidation of malate and end with reduction of aspartate in a series of six reactions. Directed arrows denote the conversion of substrate to product. The net result is a regeneration of NAD+ in the cytosol and production of NADH in the mitochondria. Abbreviations: MAL – malate, ASP – aspartate, αKG – alpha-ketoglutarate, OAA – oxaloacetate, and GLU – glutamate.
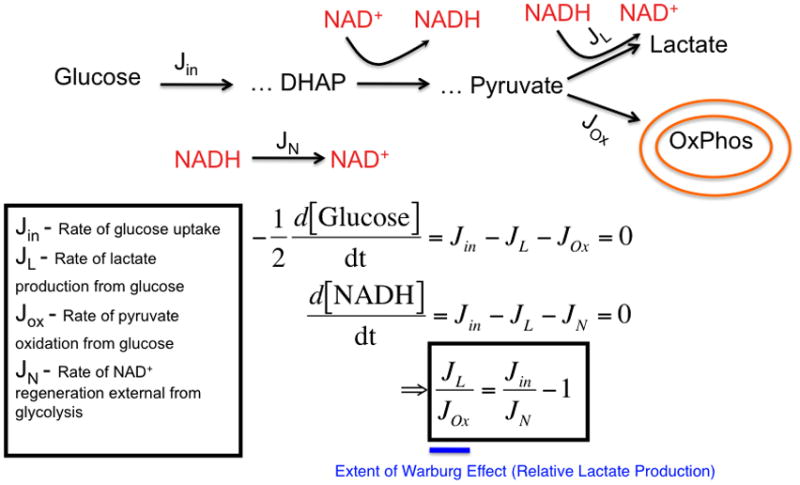
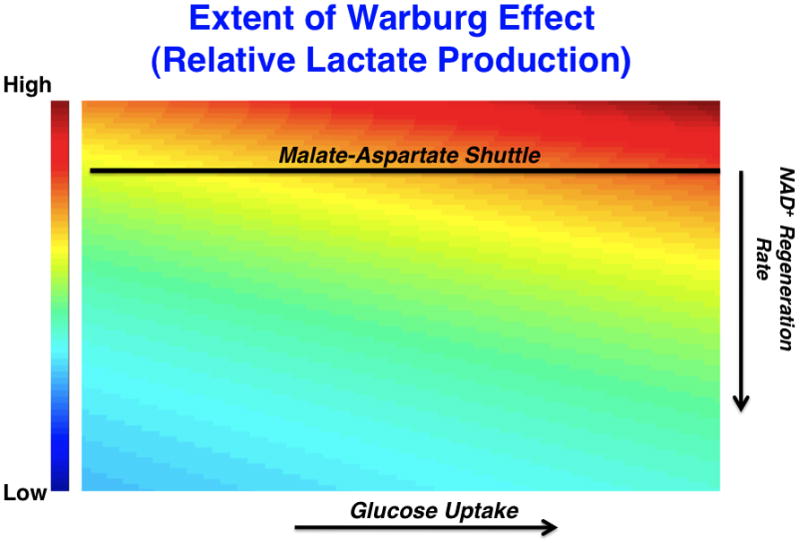
(left) A model that considers the stoichiometric balance of carbon and NAD+/NADH-generating fluxes in glycolysis and peripheral metabolism. In the model, glucose uptake and capture resulting in the generation of 2 glycolytic carbon units occurs at a rate, Jin. Glucose is metabolized through a series of steps eventually reaching an intermediate dihydroxyacetone phosphate (DHAP) at which point it is oxidized to produce NADH from NAD+. Eventually a glycolytic carbon unit reaches pyruvate where it can be reduced to produce lactate and generate NAD+ from NADH at a rate, JL. Alternatively, pyruvate can enter the mitochondria at a rate JOx. External to glycolysis, NAD+ is regenerated NADH by redox shuttles and other mechanisms. As a result, two differential equations can be written describing mass conservation of carbon and redox status and, at steady-state, can be solved for the relative rate of JL over JOx which is a measure of the extent of the Warburg effect or relative glucose-derived lactate production (in blue). (right) A representative plot of the ratio of the rate of lactate production to the rate of pyruvate entry into the mitochondria as a function of glucose uptake and NAD+ regeneration rate is shown. The extent of the Warburg effect is thus proportional to the rate of glucose uptake and inversely proportional to the rate at which NAD+ is regenerated by sources outside of Lactate dehydrogenase. The straight line represents an estimated rate of NAD+ from shuttles such as the malate-aspartate shuttle that is limited by mitochondrial transport rates. As glucose uptake increases (in the direction of the arrow on x-axis), the relative amount of glycolytic flux diverted to lactate production increases. As the rate at which NAD+ is regenerated increases (in the direction of the arrow on the y-axis), the relative amount of glycolytic flux diverted to lactate production decreases. These equations are obtained strictly from mass conservation of a model involving glucose entering glycolysis and leaving as either pyruvate or lactate. If the model allows for carbon units to exit glycolysis, then this would result in lowering the effective Jin in the equation.
(left) A model that considers the stoichiometric balance of carbon and NAD+/NADH-generating fluxes in glycolysis and peripheral metabolism. In the model, glucose uptake and capture resulting in the generation of 2 glycolytic carbon units occurs at a rate, Jin. Glucose is metabolized through a series of steps eventually reaching an intermediate dihydroxyacetone phosphate (DHAP) at which point it is oxidized to produce NADH from NAD+. Eventually a glycolytic carbon unit reaches pyruvate where it can be reduced to produce lactate and generate NAD+ from NADH at a rate, JL. Alternatively, pyruvate can enter the mitochondria at a rate JOx. External to glycolysis, NAD+ is regenerated NADH by redox shuttles and other mechanisms. As a result, two differential equations can be written describing mass conservation of carbon and redox status and, at steady-state, can be solved for the relative rate of JL over JOx which is a measure of the extent of the Warburg effect or relative glucose-derived lactate production (in blue). (right) A representative plot of the ratio of the rate of lactate production to the rate of pyruvate entry into the mitochondria as a function of glucose uptake and NAD+ regeneration rate is shown. The extent of the Warburg effect is thus proportional to the rate of glucose uptake and inversely proportional to the rate at which NAD+ is regenerated by sources outside of Lactate dehydrogenase. The straight line represents an estimated rate of NAD+ from shuttles such as the malate-aspartate shuttle that is limited by mitochondrial transport rates. As glucose uptake increases (in the direction of the arrow on x-axis), the relative amount of glycolytic flux diverted to lactate production increases. As the rate at which NAD+ is regenerated increases (in the direction of the arrow on the y-axis), the relative amount of glycolytic flux diverted to lactate production decreases. These equations are obtained strictly from mass conservation of a model involving glucose entering glycolysis and leaving as either pyruvate or lactate. If the model allows for carbon units to exit glycolysis, then this would result in lowering the effective Jin in the equation.
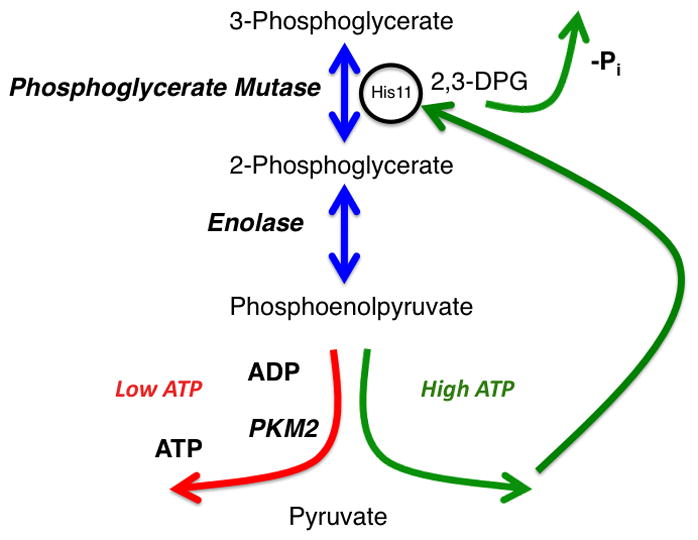
A glycolytic phosphate futile cycle that is initiated when 3-phosphoglycerate is converted to 2-phosphoglycerate by phosphoglycerate mutase. The reaction proceeds through a 2,3-diphosphoglycerate (2,3DPG) intermediate that has a tendency to dissociate from Phosphoglycerate Mutase and release an inorganic phosphate. 2-phosphoglycerate is converted to Phosphoenolpyruvate by Enolase. Two enzyme activities compete for phosphoenolpyruvate as a substrate. One activity (left) involves pyruvate kinase that transfers the phosphate group to ADP to generate pyruvate and ATP. The other involves an enzyme complex that donates the phosphate to Phosphoglycerate Mutase to prime the enzyme active site (right). In turn, this alternate glycolytic pathway results in net zero production of ATP during glycolysis.
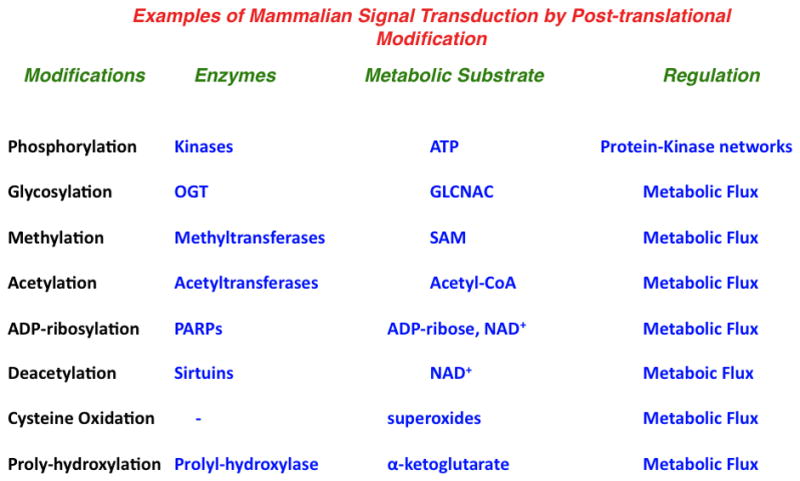
Modes of mammalian signal transduction. Examples of modifications, enzymes, substrates and the primary form of regulation are shown. Abbreviations: OGT – O-linked N-acetylglucosamine transferase, GLCNAC – N-acetylglucosamine, PARP – Poly (ADP-ribose) polymerase, SAM – S-adenosylmethionine.
References
-
- Blander G, Guarente L. The Sir2 family of protein deacetylases. Annual Review of Biochemistry. 2004;73:417–435. - PubMed
-
- Brown MS, Goldstein JL. The SREBP pathway: Regulation of cholesterol metabolism by proteolysis of a membrane-bound transcription factor. Cell. 1997;89:331–340. - PubMed
-
- Choudhary C, Kumar C, Gnad F, Nielsen ML, Rehman M, Walther TC, Olsen JV, Mann M. Lysine Acetylation Targets Protein Complexes and Co-Regulates Major Cellular Functions. Science. 2009;325:834–840. - PubMed
Publication types
MeSH terms
Substances
Grants and funding
LinkOut - more resources
Full Text Sources
Other Literature Sources
