. 2011 Nov 2;14(5):671-83.
doi: 10.1016/j.cmet.2011.08.011. Epub 2011 Oct 6.

The arrestin domain-containing 3 protein regulates body mass and energy expenditure

Affiliations

The arrestin domain-containing 3 protein regulates body mass and energy expenditure

Parth Patwari et al. Cell Metab. .

Abstract

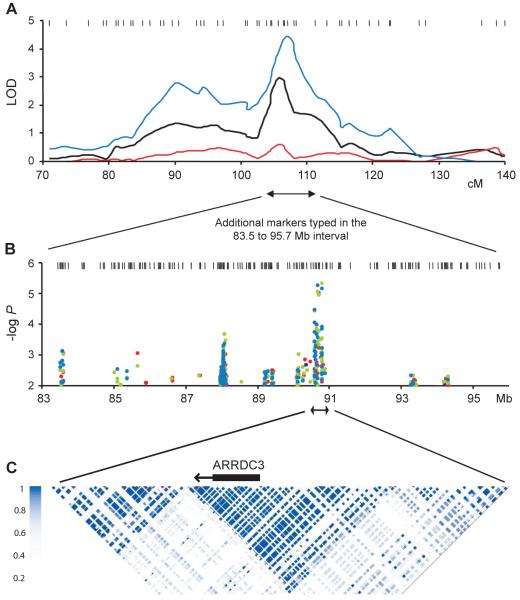
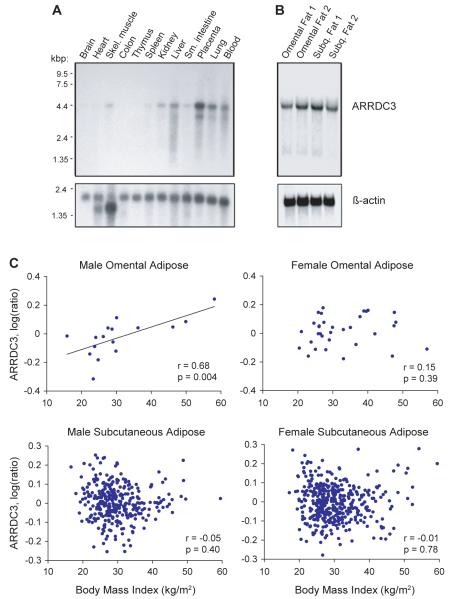
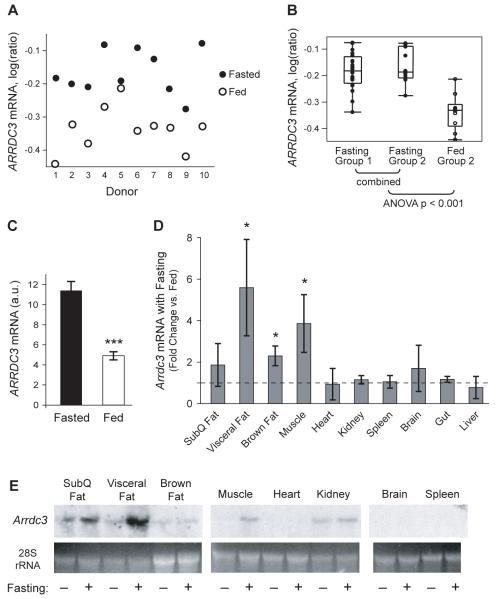
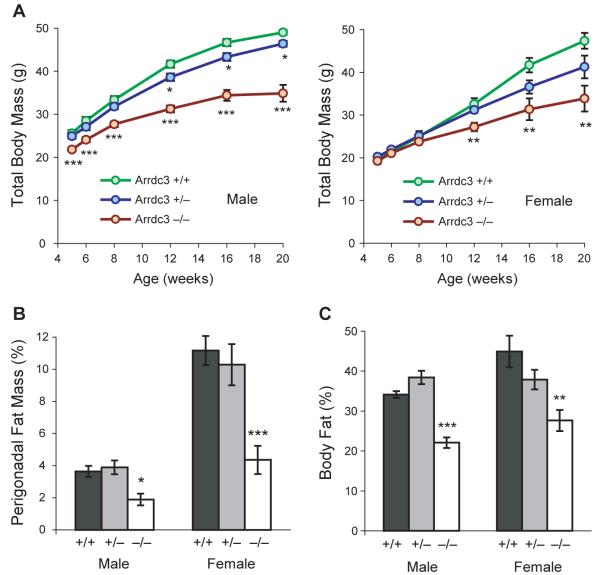
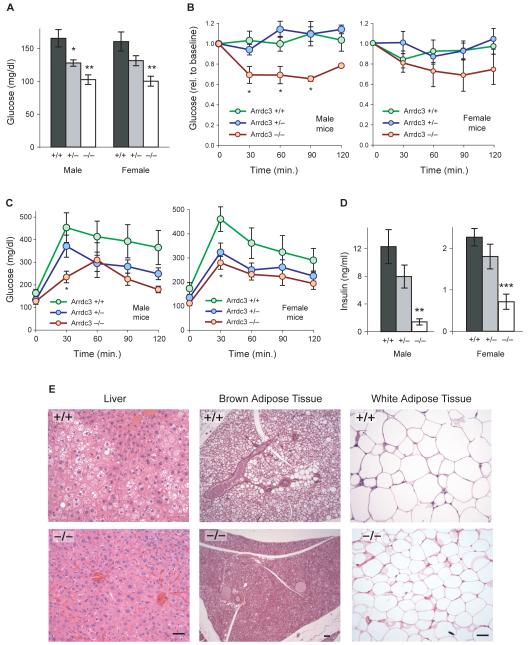
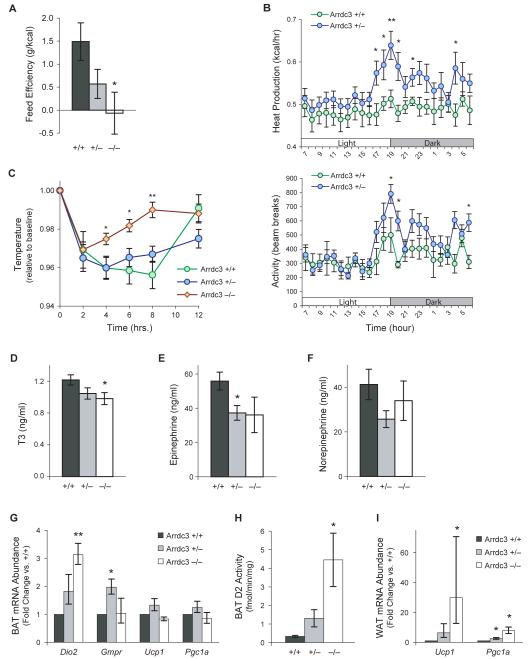
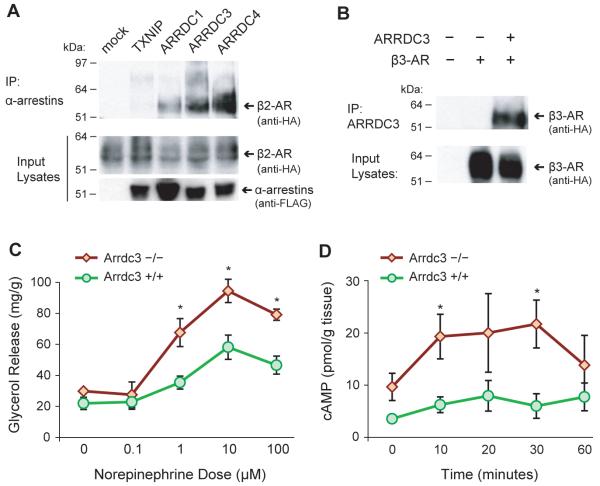
A human genome-wide linkage scan for obesity identified a linkage peak on chromosome 5q13-15. Positional cloning revealed an association of a rare haplotype to high body-mass index (BMI) in males but not females. The risk locus contains a single gene, "arrestin domain-containing 3" (ARRDC3), an uncharacterized α-arrestin. Inactivating Arrdc3 in mice led to a striking resistance to obesity, with greater impact on male mice. Mice with decreased ARRDC3 levels were protected from obesity due to increased energy expenditure through increased activity levels and increased thermogenesis of both brown and white adipose tissues. ARRDC3 interacted directly with β-adrenergic receptors, and loss of ARRDC3 increased the response to β-adrenergic stimulation in isolated adipose tissue. These results demonstrate that ARRDC3 is a gender-sensitive regulator of obesity and energy expenditure and reveal a surprising diversity for arrestin family protein functions.


Figures

Figure 1
Figure 1
Positional cloning identifies a linkage between obesity and ARRDC3 in males. (A) Linkage region on chromosome 5 showing strength of association to severe obesity (BMI > 33) in males (blue line), females (red line), and all subjects (black line). The male-specific locus on 5q13–q15 (LOD 4.6) was identified using 51 pedigrees containing 124 affected males and 257 relatives. The female-only scan included 97 families with 245 affected females and 612 relatives, and the unrestricted analysis (all subjects) was based on 168 families including 520 affecteds and 883 relatives. (B) Strength of association after additional marker genotyping in the 2-LOD drop for extremely obese males compared to population controls. Results are shown for single-marker association (black dots) and two-, three- and four-marker haplotypes (blue, green, and red dots respectively). (C) The genomic region of the peak haplotype association contains a single RefSeq gene, ARRDC3, in a discrete block of linkage disequilibrium. See also Figure S1.
Figure 2
Figure 2
Analysis of ARRDC3 gene expression. (A) Northern analysis of ARRDC3 expression in multiple human tissues. (B) Northern analysis of human omental fat and subcutaneous fat from two donors. (C) Correlation of body mass index with ARRDC3 expression levels in omental and subcutaneous adipose tissue measured by microarray analysis (for omental adipose, n = 16 males and 34 females; for subcutaneous adipose, n = 325 males and 417 females). See also Figure S2.
Figure 3
Figure 3
ARRDC3 is upregulated by fasting in humans and mice. (A) ARRDC3 expression in human subcutaneous adipose tissue biopsies from a microarray analysis. A randomized cross-over design was used to obtain paired fed and fasted data for each donor (P < 0.001; n = 10). (B) The data in panel A were combined with results of microarray analysis from a second group of 10 donors who underwent fasting on both occasions (combined P < 0.001; n = 20 fasted and 10 fed). (C) Confirmation of the effect of feeding on Arrdc3 expression by real-time PCR (***P < 0.001; n = 10/group). (D) Arrdc3 expression in multiple mouse tissues in response to a 14-hour fast (relative to mice fed ad libitum) (*P < 0.05; n = 3–4/group). (E) Northern analysis of tissues from fed and 14-hour fasting mice. Muscle, heart, kidney, brain, and spleen represent discontiguous lanes from a single blot. Error bars represent mean ± SEM. See also Figure S3.
Figure 4
Figure 4
Arrdc3-deficient mice are resistant to age-induced obesity. (A) Total body mass of littermate wild-type (+/+), heterozygous (+/−), and homozygous (−/−) Arrdc3 knockout mice from 5 to 20 weeks of age. Male n = 10–18, 15–33, 6–11; female n = 9–10, 11–30, 7–14 for +/+, +/−, and −/− genotypes respectively. (B) Perigonadal fat mass expressed as a percentage of total body mass at 5–-7 months of age. Male n = 7, 6, 3; female n = 6, 9, 5. (C) Adiposity of male and female littermates measured by DEXA scanning at 8–12 weeks of age. Male n = 7, 6, 4; female n = 6, 7, 5. Error bars represent mean ± SEM; *P < 0.05; **P < 0.01; ***P < 0.001 vs. wild-type. See also Figure S4.
Figure 5
Figure 5
Arrdc3-deficient mice are resistant to the metabolic complications of obesity. (A) Fasting blood glucose levels of littermate wild-type (+/+), heterozygous (+/−) and homozygous (−/−) Arrdc3 knockout mice at 5–7 months of age. Male n = 6, 11, 3; female n = 7, 9, 6 for +/+, +/−, and −/− genotypes, respectively. (B) The same mice were then injected with low-dose (0.25 mU/g body mass) insulin into the peritoneum. Response of blood glucose levels to insulin is expressed relative to the baseline levels shown in panel A. (C) Glucose tolerance testing of male and female littermate mice at 5-6 months of age. Blood glucose levels were measured after an intraperitoneal injection of 2 g glucose/kg body mass. Male n = 6, 10, 3; female n = 5, 11, 7. (D) Insulin levels in fed mice at 3 months of age. Male n = 8, 10, 3; female n = 5, 13, 7. (E) Histological analysis of a 9-month-old male wild-type mouse and an Arrdc3 −/− littermate. Images are representative of those observed in 3 mice of each genotype. Scale bars, 10 μm. Error bars represent mean ± SEM; *P < 0.05; **P < 0.01 vs. wild-type.
Figure 6
Figure 6
Arrdc3-deficient mice have increased energy expenditure and adipose tissue activation. (A) Food intake of 8–10-week-old female mice was measured over one week and feed efficiency calculated as the ratio of weight gain to energy intake. n = 11, 17, 6 for +/+, +/−, and −/− genotypes, respectively. (B) Metabolic cage analysis of Arrdc3 haploinsufficient and wildtype mice (n = 8 and 9 for +/+ and +/− genotypes, respectively). (C) Brown fat thermogenic function was assessed by housing mice at 4 °C. Rectal temperature was measured and expressed relative to baseline temperature (n = 6, 9, and 5). (D) Serum T3 levels in 3-month-old female mice (n = 5, 13, 6). (E-F) Serum catecholamine levels in 3-month-old female mice (n = 5, 14, 7). (G) Real-time PCR analysis of catecholamine-stimulated genes in brown adipose tissue of 3-month-old mice (n = 4, 5, 3). (H) Type 2 deiodinase activity in brown adipose tissue lysates (n = 5, 9, 5). (I) Real-time PCR analysis of thermogenic genes in visceral white adipose tissue (n = 4, 5, 3). Error bars represent mean ± SEM; *P < 0.05; **P < 0.01 vs. wild-type. See also Figure S5 and Table S1.
Figure 7
Figure 7
ARRDC3 interacts with β-adrenergic receptors to regulate signaling in adipose tissue. (A) Co-immunoprecipitation of HA-tagged β2-adrenergic receptor with FLAG-tagged α-arrestins. (B) Co-immunoprecipitation of β3-adrenergic receptor with ARRDC3. (C) Glycerol release from cultured white adipose tissue in response to norepinephrine (n = 3 mice/genotype). (D) Time course of cyclic AMP levels in white adipose tissue in response to norepinephrine (n = 3 mice/genotype). Error bars represent mean ± SEM; *P < 0.05 vs. wild-type.

Similar articles

Cited by

References

    1. Alvarez CE. On the origins of arrestin and rhodopsin. BMC Evol Biol. 2008;8:222. - PMC - PubMed
    1. Andrikopoulos S, Blair AR, Deluca N, Fam BC, Proietto J. Evaluating the glucose tolerance test in mice. Am. J. Physiol. Endocrinol. Metab. 2008;295:E1323–1332. - PubMed
    1. Anunciado-Koza R, Ukropec J, Koza RA, Kozak LP. Inactivation of UCP1 and the glycerol phosphate cycle synergistically increases energy expenditure to resist diet-induced obesity. J. Biol. Chem. 2008;283:27688–27697. - PMC - PubMed
    1. Aubry L, Guetta D, Klein G. The arrestin fold: variations on a theme. Curr. Genomics. 2009;10:133–142. - PMC - PubMed
    1. Bell CG, Benzinou M, Siddiq A, Lecoeur C, Dina C, Lemainque A, Clément K, Basdevant A, Guy-Grand B, Mein CA, et al. Genome-wide linkage analysis for severe obesity in french caucasians finds significant susceptibility locus on chromosome 19q. Diabetes. 2004;53:1857–1865. - PubMed

Publication types

MeSH terms