Review
. 2012 Dec;18(6):567-88.
doi: 10.1177/1073858411423441. Epub 2011 Oct 7.

Structural remodeling of astrocytes in the injured CNS

Affiliations
Review

Structural remodeling of astrocytes in the injured CNS

Daniel Sun et al. Neuroscientist. 2012 Dec.

Abstract

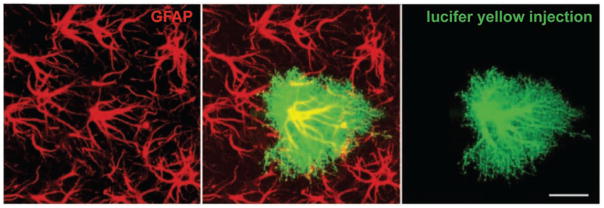
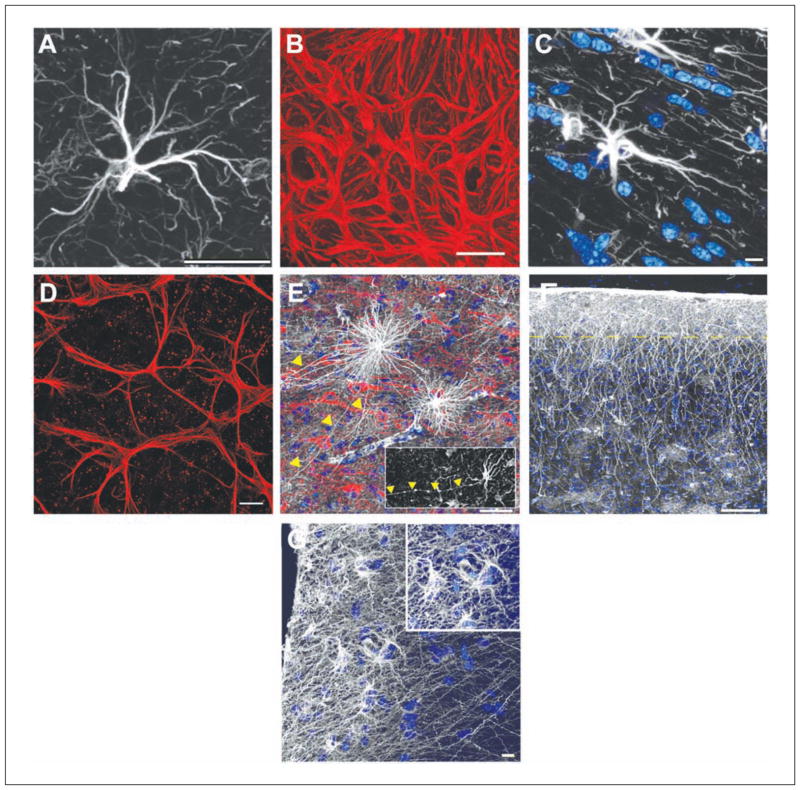
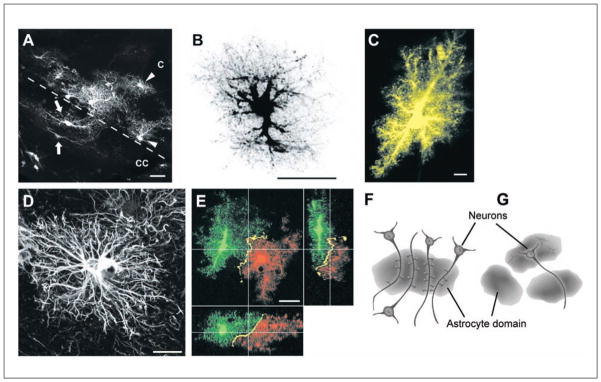
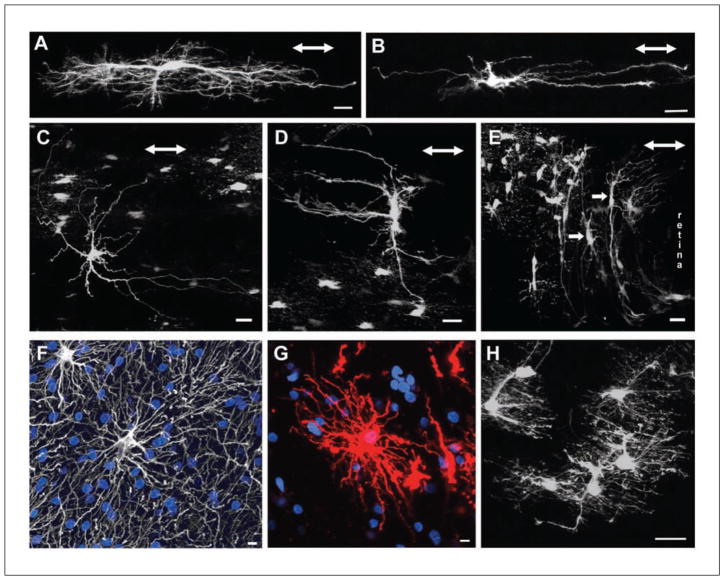
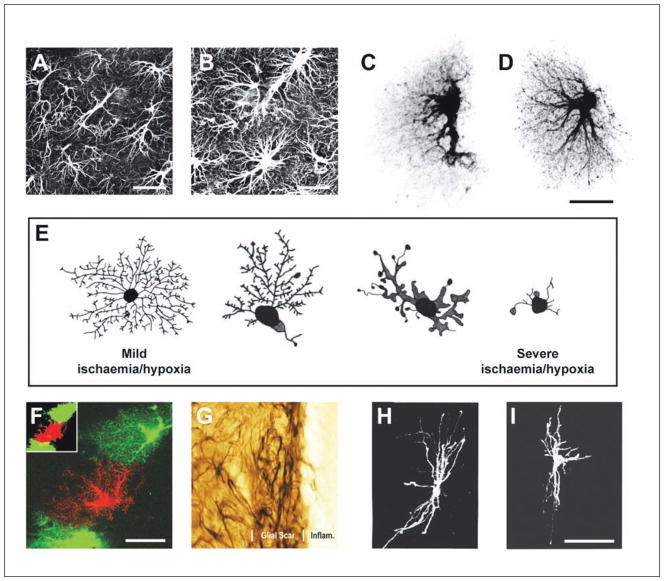
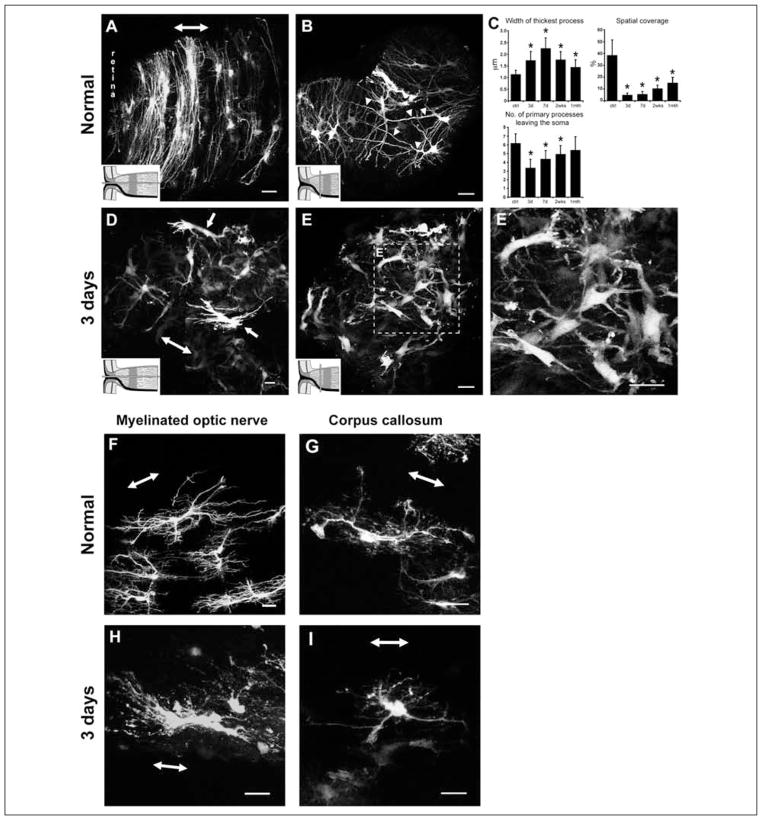
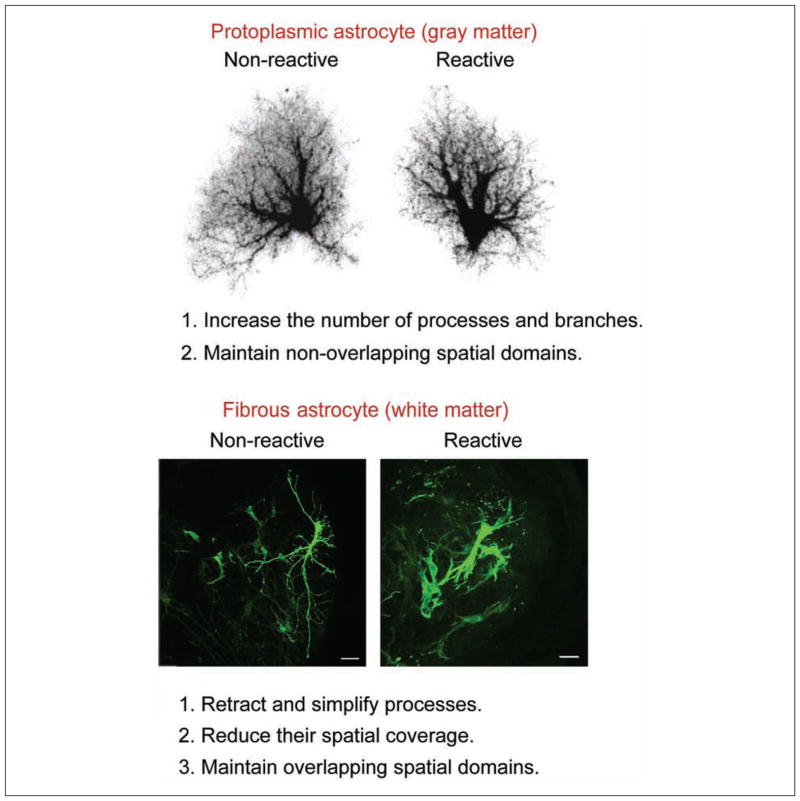
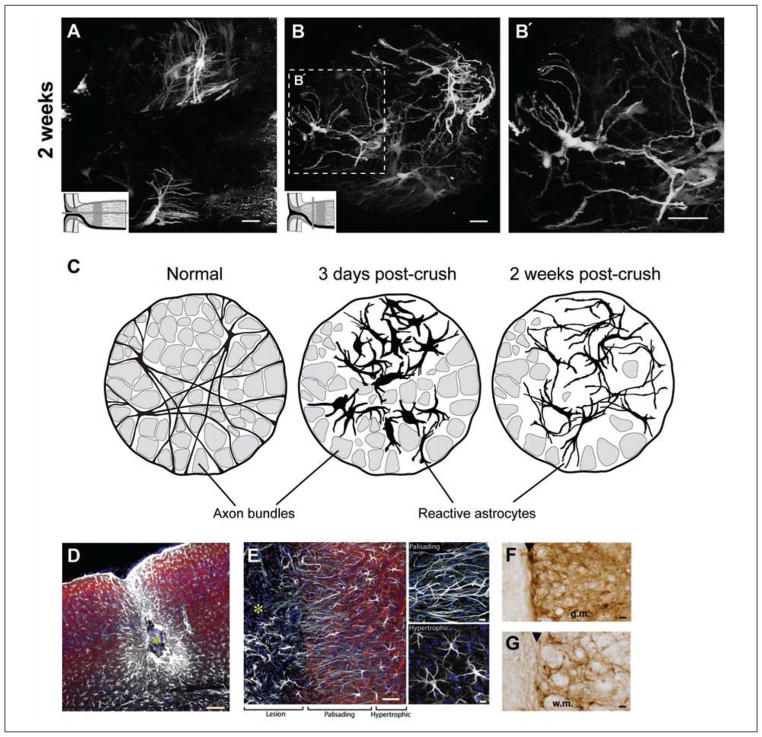
Astrocytes respond to all forms of CNS insult and disease by becoming reactive, a nonspecific but highly characteristic response that involves various morphological and molecular changes. Probably the most recognized aspect of reactive astrocytes is the formation of a glial scar that impedes axon regeneration. Although the reactive phenotype was first suggested more than 100 years ago based on morphological changes, the remodeling process is not well understood. We know little about the actual structure of a reactive astrocyte, how an astrocyte remodels during the progression of an insult, and how populations of these cells reorganize to form the glial scar. New methods of labeling astrocytes, along with transgenic mice, allow the complete morphology of reactive astrocytes to be visualized. Recent studies show that reactivity can induce a remarkable change in the shape of a single astrocyte, that not all astrocytes react in the same way, and that there is plasticity in the reactive response.


Conflict of interest statement

Declaration of Conflicting Interests

The author(s) declared no potential conflicts of interest with respect to the research, authorship, and/or publication of this article.

Figures

None
Dye-filling individual astrocytes with lucifer yellow shows the many fine processes that are not visualized by labeling with a GFAP antibody. GFAP-containing intermediate filaments are abundant in the main processes of the astrocyte but not detectable in the fine and terminal processes. Scale bar = 20 μm. Adapted from Wilhelmsson and others (2004).
Figure 1
Figure 1
The various morphologies of GFAP-labeled astrocytes. (A) A typical mouse protoplasmic astrocyte demonstrating the stellate morphology. Scale bar = 20 μm. (B) The processes of astrocytes within the optic nerve head overlap and form a dense meshwork. The boundaries between neighboring astrocytes are not visible. Scale bar = 20 μm. (C) A typical mouse fibrous astrocyte in the white matter. Nuclear stain, blue. Scale bar = 10 μm. (D) The processes of astrocytes within the mouse retina overlap. Similar to the optic nerve, it is not clear where the boundaries of an astrocyte lie. Scale bar = 20 μm. (E) Varicose projection astrocytes reside in layers 5 to 6 of the human cortex and extend long processes characterized by evenly spaced varicosities. Inset: A varicose projection astrocyte from a chimpanzee cortex. Scale bar = 50 μm. (F) Primate-specific interlaminar astrocytes occupy layer 1 of the cortex. Yellow dotted line indicates the border between layers 1 and 2. Scale bar = 100 μm. (G) High-power image of layer 1 showing interlaminar astrocytes. Inset: The cell bodies. Scale bar = 10 μm. Panels A, C, E, F, and G adapted from Oberheim and others (2009).
Figure 2
Figure 2
(A) Protoplasmic astrocytes in the cortex (C) of the hGFAPpr-EGFP mouse lying adjacent to fibrous astrocytes in the corpus callosum (CC). Although both types of astrocytes appear similar when labeled with GFAP, they are morphologically distinct when their complete morphology is visualized. Scale bar = 20 μm. (B) A dye-filled protoplasmic astrocyte from the hippocampus, revealing the fine spongiform processes. Scale bar = 25 μm. (C) Protoplasmic astrocytes in CA1 stratum radiatum are fusiform in shape, rather than spherical, as in the cortex. Scale bar = 10 μm. (D) A typical GFAP-labeled human protoplasmic astrocyte. These astrocytes are larger and more complex than in the mouse. Scale bar = 20 μm. (E) Neighboring protoplasmic astrocytes organize themselves in nonoverlapping spatial domains, with minimal overlap of their most peripheral processes. Scale bar = 20 μm. (F) A diagram illustrating the concept of functional synaptic islands. A group of dendrites from several neurons are enwrapped by a single astrocyte. Synapses within the territory of this astrocyte have the potential to be modulated in a coordinated manner by gliotransmitters released from this astrocyte. (G) A diagram showing the domains of three astrocytes. A single neuron may extend its processes into the domain of another astrocyte, pointing to the potential of different neuronal compartments being modulated by different astrocytes. Panels B and E adapted from Wilhelmsson and others (2006). Panel C adapted from Oberheim and others (2009). Panel D adapted from Bushong and others (2002). Panels F and G adapted from Halassa and others (2007).
Figure 3
Figure 3
(A) Longitudinally oriented fibrous astrocyte from the myelinated region of the hGFAPpr-EGFP optic nerve. In this example, the processes are “hairy” with many fine branches. Scale bar = 20 μm. (B) Another example of a fibrous astrocyte from the myelinated optic nerve. This astrocyte is less complex and has smoother processes. Scale bar = 20 μm. (C) An example of a randomly oriented fibrous astrocyte. These astrocytes have processes extending both longitudinally and transversely to the long axis of the nerve. Scale bar = 20 μm. (D) An example of a transversely oriented fibrous astrocyte. Scale bar = 20 μm. (E) The optic nerve head consists predominantly of transversely oriented astrocytes with thick elongated cell bodies and primary processes extending long distances (arrows). These astrocytes have very few processes extending in parallel to the long axis of the nerve. Scale bar = 20 μm. (F) A human fibrous astrocyte in the white matter labeled with GFAP. Nuclear stain, blue. Scale bar = 10 μm. (G) Human fibrous astrocyte labeled with DiI, revealing the full structure of the cell. DiI, red. Nuclear stain, blue. Scale bar = 10 μm. (H) The processes of neighboring fibrous astrocytes overlap extensively. Scale bar = 20 μm. The double-headed arrow in panels A to E represents the direction of the long axis of the optic nerve. Panels A and H adapted from Sun and others (2010). Panels B, D, and E adapted from Sun and others (2009). Panels F and G adapted from Oberheim and others (2009).
Figure 4
Figure 4
(A) Antibodies against GFAP label the intermediate filaments predominantly found in the soma and the main processes of astrocytes. Scale bar = 25 μm. (B) Reactive astrocytes up-regulate the expression of GFAP, demonstrating hypertrophy of the cell bodies and processes. Scale bar = 25 μm. (C) A dye-filled astrocyte from the hippocampus, revealing the spongiform nature of these cells. (D) Reactive protoplasmic astrocytes undergo hypertrophy of the cell body and processes and increase the number of main processes leaving the soma and the number of fine branches. Scale bar = 25 μm. (E) A schematic showing ischemia/hypoxia induces a different morphological change in cortical astrocytes. As the severity of the insult increases, there is increased hypertrophy and a decrease in the complexity of the branching pattern. (F) Neighboring reactive protoplasmic astrocytes maintain nonoverlapping spatial domains. Scale bar = 25 μm. (G) The reaction of astrocytes to insult is spatially distinct. Reactive astrocytes immediately adjacent to a lesion have processes that overlap extensively and interdigitate, forming a distinct boundary around the lesion. Scale bar = 8 μm. (H) A typical transverse oriented fibrous astrocyte from the rat optic nerve. (I) Reactive fibrous astrocytes remodel differently from protoplasmic astrocytes. Unlike protoplasmic astrocytes, astrocytes in the myelinated optic nerve show a reduction in the number of processes and branchings, a thickening of remaining processes, and a withdrawal of radial processes ending at the glia limitans. This reduces the overall complexity of the branching structure. Scale bar = 50 μm. Panels A to D and F adapted from Wilhelmsson and others (2006). Panel E adapted from Sullivan and others (2010). Panel G adapted from Sofroniew (2009). Panels H and I adapted from Butt and Colquhoun (1996).
Figure 5
Figure 5
Normal and reactive fibrous astrocytes in the optic nerve head, myelinated optic nerve, and corpus callosum of the hGFAPpr-EGFP mouse. (A) Normal astrocytes in the optic nerve head have processes that are transversely arranged to form a sheet-like arrangement. (B) They have long primary processes that traverse the entire width of the optic nerve to contact the pial wall (arrowheads). The processes of neighboring astrocytes overlap extensively. (C) Quantitative analysis of changes in the morphological parameters after an optic nerve crush. (D) At 3 days after nerve crush, astrocytes become reactive, show hypertrophy of the soma and processes, and lose their transverse orientation. (E–E′) They retract their primary and higher order processes. The shortening of processes reduces the spatial coverage of individual astrocytes. (F) Longitudinally oriented astrocytes in the myelinated optic nerve were hairy in appearance, with many small fine processes projecting from the primary processes. (G) Astrocytes in the corpus callosum were similar in appearance to those in the myelinated optic nerve. Their main processes run in parallel to the nerve fibers. (H, I) Three days after crush, these astrocytes showed changes similar to those for reactive astrocytes in the optic nerve head: hypertrophy of the soma and remaining processes and retraction of their primary and higher order processes. The schematic in panels A, B, D, and E depicts how the optic nerve was sectioned (gray bars). The double-headed arrow in some panels indicates the direction of the long axis of the optic nerve. Scale bar in all panels = 20 μm. All panels adapted from Sun and others (2010).
Figure 6
Figure 6
Fibrous astrocytes react very differently to protoplasmic astrocytes following mechanical injury. Although both types of astrocytes undergo hypertrophy of the cell bodies and processes, fibrous astrocytes retract and simplify their branching structure. Scale bar = 20 μm.
Figure 7
Figure 7
Reactive fibrous astrocytes from the optic nerve head of the hGFAPpr-EGFP mouse 2 weeks after nerve crush. Longitudinal (A) and transverse (B–B′) sections show that by 2 weeks after nerve crush, the morphology of astrocytes has returned to a near normal appearance. There was thinning and re-extension of many of the processes compared to 3 days (see Fig. 5D–5E′), although they never recover their original length. The processes follow a tortuous path and do not form glial tubes. The schematic in A and B depicts how the optic nerve was sectioned (gray bars). Scale bar in panels A to B′ = 20 μm. (C) Schematic representation of the two-stage remodeling process of reactive astrocytes within the glial lamina. Fibrous astrocytes initially respond by hypertrophy of the soma and proximal processes and retraction of the distal ones. This reduces their spatial domain and disrupts the organization of the glial tubes. By 2 weeks after crush, the processes have re-extended, and their thickness is reduced. (D) The site of injury after ferrous chloride injection. The center of the lesion (yellow asterisk) is surrounded by palisading astrocytes and, at a greater distance, by hypertrophic astrocytes. Scale bar = 100 μm. (E) High-power image of the border of an injury site. Palisading astrocytes directly adjacent to the lesion extend long processes oriented toward the lesion site (<200 μm). Their processes overlap extensively. Hypertrophic astrocytes (200–1000 μm) displayed less pronounced reactive changes, and their processes were not oriented towards the lesion site. Scale bar = 50 μm. Scale bar in top and bottom right panels = 10 μm. (F) The boundary zone in the gray matter (g.m.) of a spinal cord lesion showing the demarcation formed by an organized scar (black arrowhead). The processes of β-gal–stained astrocytes overlap extensively within 100 μm of the lesion. Scale bar = 30 μm. (G) A similar zone in the white matter (w.m.) of a spinal cord lesion. Here too, processes of neighboring astrocytes overlap. Scale bar = 30 μm. Panels A to C adapted from Sun and others (2010). Panels D and E adapted from Oberheim and others (2008). Panels F and G adapted from Herrmann and others (2008).

References

    1. Allansson L, Khatibi S, Gustavsson T, Blomstrand F, Olsson T, Hansson E. Single-cell volume estimation by three-dimensional wide-field microscopy applied to astroglial primary cultures. J Neurosci Methods. 1999;93(1):1–11. - PubMed
    1. Angulo MC, Kozlov AS, Charpak S, Audinat E. Glutamate released from glial cells synchronizes neuronal activity in the hippocampus. J Neurosci. 2004;24(31):6920–7. - PMC - PubMed
    1. Bachoo RM, Kim RS, Ligon KL, Maher EA, Brennan C, Billings N, et al. Molecular diversity of astrocytes with implications for neurological disorders. Proc Natl Acad Sci U S A. 2004;101(22):8384–9. - PMC - PubMed
    1. Benediktsson AM, Schachtele SJ, Green SH, Dailey ME. Ballistic labeling and dynamic imaging of astrocytes in organotypic hippocampal slice cultures. J Neurosci Methods. 2005;141(1):41–53. - PubMed
    1. Benesova J, Hock M, Butenko O, Prajerova I, Anderova M, Chvatal A. Quantification of astrocyte volume changes during ischemia in situ reveals two populations of astrocytes in the cortex of GFAP/EGFP mice. J Neurosci Res. 2009;87(1):96–111. - PubMed

Publication types

LinkOut - more resources