

Isolation and molecular characterization of Rem2 isoforms in the rainbow trout (Oncorhynchus mykiss): Tissue and central nervous system expression
- PMID: 21983188
- PMCID: PMC3242864
- DOI: 10.1016/j.cbpb.2011.09.011
Isolation and molecular characterization of Rem2 isoforms in the rainbow trout (Oncorhynchus mykiss): Tissue and central nervous system expression
Abstract
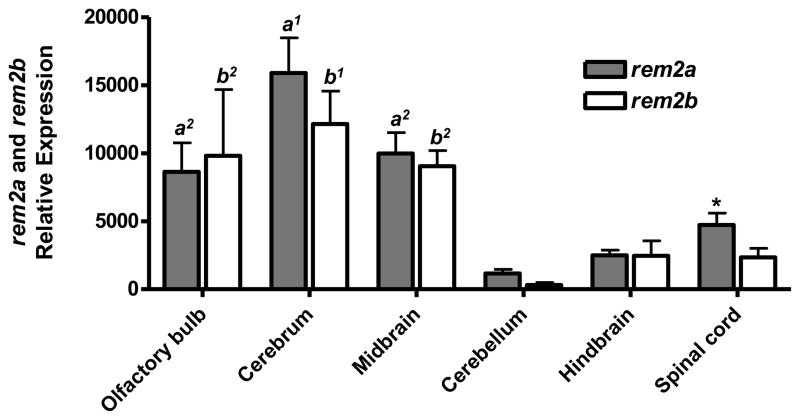
REM2 is a member of the REM, RAD, and GEM/KIR (RGK) subfamily of RAS superfamily proteins and plays an important role in brain development and function. In this study, two Rem2 isoforms were isolated from the rainbow trout (Oncorhynchus mykiss). The two genes, designated O. mykiss rem2a and rem2b, both encode 304 amino acid proteins with 61% and 62% identities to zebrafish (Danio rerio) Rem2, respectively, and each with 43% identity to mammalian (human) REM2. To our knowledge, this is the first incidence of Rem2 isoforms in a species that are the result of gene duplication. Both isoforms possessed similar tissue expression profiles with the highest levels in the brain. The rem2a gene has significantly higher expression levels than rem2b in all tissues assayed except the brain and head kidney. In the central nervous system, both isoforms showed similar expression levels with the highest levels occurring in the olfactory bulb, cerebrum, and midbrain, though rem2a expression is significantly higher in the spinal cord. Based on known functional roles of Rem2 in synapse development and stem cell proliferation, the characterization of Rem2 in rainbow trout could shed light on its role in adult vertebrate neurogenesis and brain regeneration.
Copyright © 2011 Elsevier Inc. All rights reserved.
Figures

 ) indicate where trout rem2a and rem2b differ. The location of the primers and probes used in gene expression assays are underlined.
 >50%,
>50%,
 > 75%,
 = 100%). The arrow (▾) indicates where the trout isoforms differ. Consensus sequences for GTP-binding regions (G1–G5) and the conserved C7 sequence motif are indicated below the alignments (Finlin et al., 2000). The G3 consensus shown is that which is unique to the RGK subfamily. The binding sites for the 14-3-3 protein are indicated with an asterisk (Correll et al., 2009). Bold lines below the alignment indicate N-terminal and C-terminal extensions (Splingard et al., 2007). The solid boxes indicate the mammalian REM2 extended N-terminus and C-terminus following Seu and Pitt (2006). The dashed box indicates the SH3 (Src homology 3) binding motif (Splingard et al., 2007). Underlined methionines (
Similar articles
-
Rem2 in the bullfrog (Rana catesbeiana): Patterns of expression within the central nervous system and brain expression at different ontogenetic stages.Gene. 2014 Apr 25;540(1):37-45. doi: 10.1016/j.gene.2014.02.030. Epub 2014 Feb 24. Gene. 2014. PMID: 24576576 Free PMC article.
-
Localization of rem2 in the central nervous system of the adult rainbow trout (Oncorhynchus mykiss).J Chem Neuroanat. 2016 Dec;78:87-95. doi: 10.1016/j.jchemneu.2016.09.001. Epub 2016 Sep 4. J Chem Neuroanat. 2016. PMID: 27600327 Free PMC article.
-
Genomic structure and expression of uncoupling protein 2 genes in rainbow trout (Oncorhynchus mykiss).BMC Genomics. 2006 Aug 9;7:203. doi: 10.1186/1471-2164-7-203. BMC Genomics. 2006. PMID: 16899121 Free PMC article.
-
Rem2, a new member of the Rem/Rad/Gem/Kir family of Ras-related GTPases.Biochem J. 2000 Apr 1;347 Pt 1(Pt 1):223-31. Biochem J. 2000. PMID: 10727423 Free PMC article.
-
Molecular characterization of the prolactin receptor in two fish species, tilapia Oreochromis niloticus and rainbow trout, Oncorhynchus mykiss: a comparative approach.Can J Physiol Pharmacol. 2000 Dec;78(12):1086-96. Can J Physiol Pharmacol. 2000. PMID: 11149385 Review.
Cited by
-
The evolution of mammalian Rem2: unraveling the impact of purifying selection and coevolution on protein function, and implications for human disorders.Front Bioinform. 2024 Jun 24;4:1381540. doi: 10.3389/fbinf.2024.1381540. eCollection 2024. Front Bioinform. 2024. PMID: 38978817 Free PMC article.
-
Rem2 in the bullfrog (Rana catesbeiana): Patterns of expression within the central nervous system and brain expression at different ontogenetic stages.Gene. 2014 Apr 25;540(1):37-45. doi: 10.1016/j.gene.2014.02.030. Epub 2014 Feb 24. Gene. 2014. PMID: 24576576 Free PMC article.
-
Localization of rem2 in the central nervous system of the adult rainbow trout (Oncorhynchus mykiss).J Chem Neuroanat. 2016 Dec;78:87-95. doi: 10.1016/j.jchemneu.2016.09.001. Epub 2016 Sep 4. J Chem Neuroanat. 2016. PMID: 27600327 Free PMC article.
-
Rem2, a member of the RGK family of small GTPases, is enriched in nuclei of the basal ganglia.Sci Rep. 2016 Apr 27;6:25137. doi: 10.1038/srep25137. Sci Rep. 2016. PMID: 27118437 Free PMC article.
-
Ancient origins of RGK protein function: modulation of voltage-gated calcium channels preceded the protostome and deuterostome split.PLoS One. 2014 Jul 3;9(7):e100694. doi: 10.1371/journal.pone.0100694. eCollection 2014. PLoS One. 2014. PMID: 24992013 Free PMC article.
References
-
- Allendorf FW, Thorgaard GH. Tetraploidy and the evolution of salmonid fishes. In: Turner BJ, editor. The Evolutionary Genetics of Fishes. Plenum Press; New York: 1984. pp. 1–53.
-
- Bierings R, Beato M, Edel MJ. An endothelial cell genetic screen identifies the GTPase Rem2 as a suppressor of p19ARF expression that promotes endothelial cell proliferation and angiogenesis. J Biol Chem. 2008;283:4408–4416. - PubMed
-
- Chapouton P, Jagasia R, Bally-Cuif L. Adult neurogenesis in non-mammalian vertebrates. Bioessays. 2007;29:745–757. - PubMed
Publication types
MeSH terms
Substances
Associated data
- Actions
- Actions
Grants and funding
LinkOut - more resources
Full Text Sources
Molecular Biology Databases
Research Materials
