. 2012 Mar;40(3):876-85.
doi: 10.1097/CCM.0b013e318232e314.

Systemic release of cytokines and heat shock proteins in porcine models of polytrauma and hemorrhage*

Affiliations

Systemic release of cytokines and heat shock proteins in porcine models of polytrauma and hemorrhage*

Todd A Baker et al. Crit Care Med. 2012 Mar.

Abstract

Objective: To define systemic release kinetics of a panel of cytokines and heat shock proteins in porcine polytrauma/hemorrhage models and to evaluate whether they could be useful as early trauma biomarkers.

Design: Prospective observational study.

Setting: Research laboratory.

Subjects: Twenty-one Yorkshire pigs.

Interventions: None.

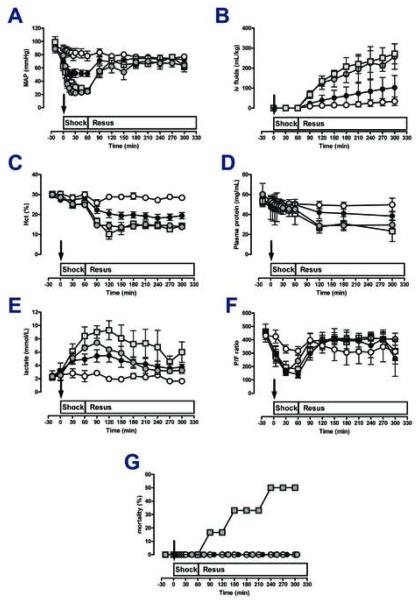
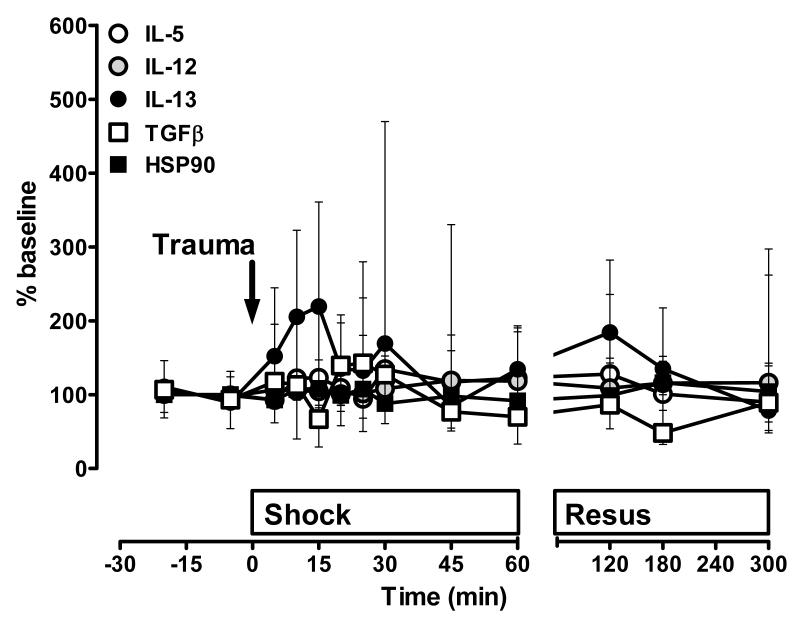
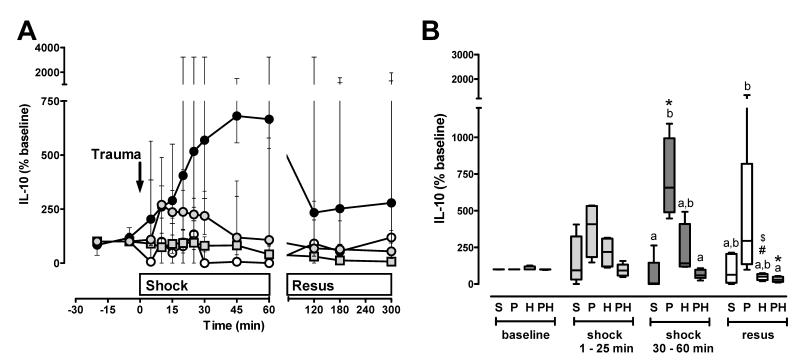
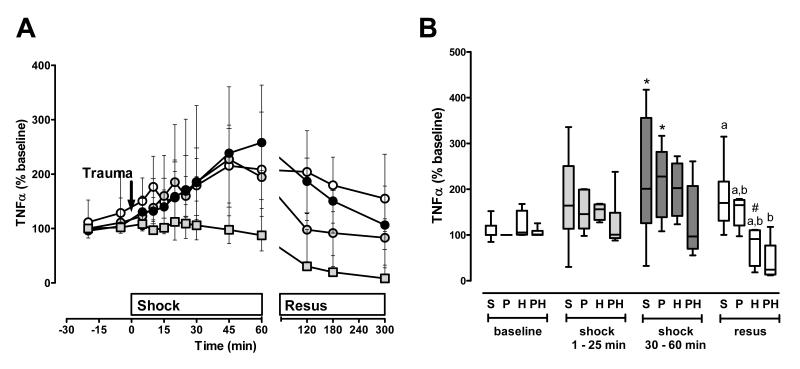
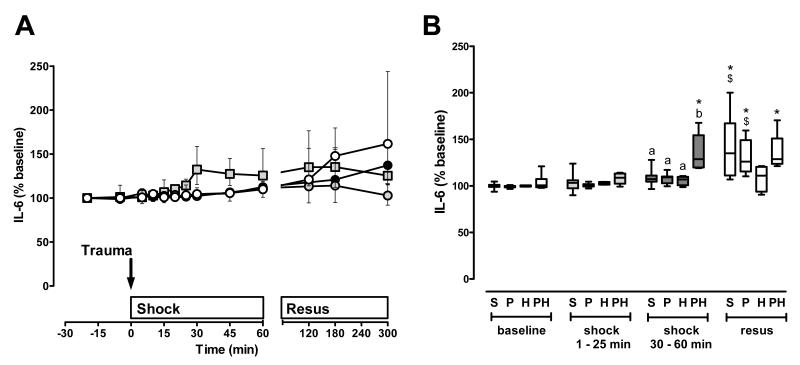
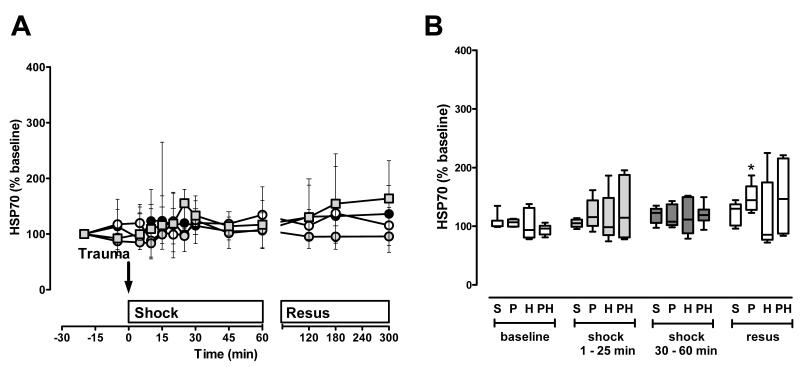
Measurements and main results: Pigs underwent polytrauma (femur fractures/lung contusion, P), hemorrhage (mean arterial pressure 25-30 mm Hg, H), polytrauma plus hemorrhage (P/H), or sham procedure (S). Plasma was obtained at baseline, in 5- to 15-min intervals during a 60-min shock period without intervention, and in 60- to 120-min intervals during fluid resuscitation for up to 300 min. Plasma was assayed for interleukin-1β, interleukin-4, interleukin-5, interleukin-6, interleukin-8, interleukin-10, interleukin-12/interleukin-23p40, interleukin-13, interleukin-17, interleukin-18, interferonγ, transforming growth factor-β, tumor necrosis factor-α, heat shock protein 40, heat shock protein 70, and heat shock protein 90 by enzyme-linked immunosorbent assay. All animals after S, P, and H survived (n = 5/group). Three of six animals after P/H died. Interleukin-10 increased during shock after P and this increase was attenuated after H. Tumor necrosis factor-α increased during the shock period after P, H, and also after S. P/H abolished the systemic interleukin-10 and tumor necrosis factor-α release and resulted in 20% to 30% increased levels of interleukin-6 during shock. As fluid resuscitation was initiated, tumor necrosis factor-α and interleukin-10 levels decreased after P, H, and P/H; heat shock protein 70 increased after P; and interleukin-6 levels remained elevated after P/H and also increased after P and S.

Conclusions: Differential regulation of the systemic cytokine release after polytrauma and/or hemorrhage, in combination with the effects of resuscitation, can explain the variability and inconsistent association of systemic cytokine/heat shock protein levels with clinical variables in trauma patients. Insults of major severity (P/H) partially suppress the systemic inflammatory response. The plasma concentrations of the measured cytokines/heat shock proteins do not reflect injury severity or physiological changes in porcine trauma models and are unlikely to be able to serve as useful trauma biomarkers in patients.


Figures

Figure 1
Figure 1. Physiological responses to trauma and hemorrhage
Arrows indicate the time point of injury/hemorrhage. Resus: Resuscitation period. Data are mean ± SD. Open circles: sham control, n=5. Black circles: Polytrauma only, n=5. Grey circles: Hemorrhage only, n=5. Grey squares: Polytrauma plus hemorrhage, n=3-6. A. Mean arterial pressure (MAP, mmHg). B. I.v. fluids: Intravenous fluid requirements (mL/kg body weight). C. Hematocrit (%). D. Plasma protein concentrations (mg/mL). E. Plasma lactate concentrations (mmol/L). F. P/F ratio: ratio of arterial oxygen concentration to the fraction of inspired oxygen. G. Mortality (%).
Figure 2
Figure 2. Plasma concentrations of cytokines/heat shock proteins without significant changes after polytrauma alone
Data are expressed as % of the individual baseline concentrations and plotted as median with interquartile range. n=5 per time point. Open circles: IL-5. Grey circles: IL-12. Black circles: IL-13. Open squares: TGFβ. Black squares: HSP90. The arrow indicates the time point of injury. Resus: Resuscitation period.
Figure 3
Figure 3. IL-10 plasma concentrations after polytrauma and hemorrhage
A. Time course. Data are expressed as % of the individual baseline concentrations and plotted as median with interquartile range. Open circles: Sham control, n=5. Black circles: Polytrauma only, n=5. Grey circles: Hemorrhage only, n=5. Grey squares: Polytrauma plus hemorrhage, n=3-6. The arrow indicates the time point of injury/hemorrhage. Resus: Resuscitation period. B. Average IL-10 plasma levels during the individual experimental phases (baseline, early shock phase (t=1-25 min), late shock phase (30-60 min), resuscitation phase (resus)). S: Sham control. Average plasma levels for each animal were calculated as the mean of all plasma levels which were determined during each time period; data from A. P: Polytrauma only. H: Hemorrhage only. PH: Polytrauma plus hemorrhage. Boxes extend from the 25th to 75th percentile; the horizontal line shows the median. Error bars show the 10th and 90th percentile. Groups not sharing the same letter are significantly different (p<0.05) during each individual experimental phase. *: p<0.05 vs. baseline. $: p<0.05 vs. early shock period (1-25 min). #: p<0.05 vs. late shock period (30-60 min).
Figure 4
Figure 4. TNFα plasma concentrations after polytrauma and hemorrhage
A. Time course. Data are expressed as % of the individual baseline concentrations and plotted as median with interquartile range. Open circles: Sham control, n=5. Black circles: Polytrauma only, n=5. Grey circles: Hemorrhage only, n=5. Grey squares: Polytrauma plus hemorrhage, n=3-6. The arrow indicates the time point of injury/hemorrhage. Resus: Resuscitation period. B. Average TNFα plasma levels during the individual experimental phases (baseline, early shock phase (t=1-25 min), late shock phase (30-60 min), resuscitation phase (resus)). S: Sham control. Average plasma levels for each animal were calculated as the mean of all plasma levels which were determined during each time period; data from A. P: Polytrauma only. H: Hemorrhage only. PH: Polytrauma plus hemorrhage. Boxes extend from the 25th to 75th percentile; the horizontal line shows the median. Error bars show the 10th and 90th percentile. Groups not sharing the same letter are significantly different (p<0.05) during each individual experimental phase. *: p<0.05 vs. baseline. $: p<0.05 vs. early shock period (1-25 min). #: p<0.05 vs. late shock period (30-60 min).
Figure 5
Figure 5. IL-6 plasma concentrations after polytrauma and hemorrhage
A. Time course. Data are expressed as % of the individual baseline concentrations and plotted as median with interquartile range. Open circles: Sham control, n=5. Black circles: Polytrauma only, n=5. Grey circles: Hemorrhage only, n=5. Grey squares: Polytrauma plus hemorrhage, n=3-6. The arrow indicates the time point of injury/hemorrhage. Resus: Resuscitation period. B. Average IL-6 plasma levels during the individual experimental phases (baseline, early shock phase (t=1-25 min), late shock phase (30-60 min), resuscitation phase (resus)). S: Sham control. Average plasma levels for each animal were calculated as the mean of all plasma levels which were determined during each time period; data from A. P: Polytrauma only. H: Hemorrhage only. PH: Polytrauma plus hemorrhage. Boxes extend from the 25th to 75th percentile; the horizontal line shows the median. Error bars show the 10th and 90th percentile. Groups not sharing the same letter are significantly different (p<0.05) during each individual experimental phase. *: p<0.05 vs. baseline. $: p<0.05 vs. early shock period (1-25 min). #: p<0.05 vs. late shock period (30-60 min).
Figure 6
Figure 6. HSP70 plasma concentrations after polytrauma and hemorrhage
A. Time course. Data are expressed as % of the individual baseline concentrations and plotted as median with interquartile range. Open circles: Sham control, n=5. Black circles: Polytrauma only, n=5. Grey circles: Hemorrhage only, n=5. Grey squares: Polytrauma plus hemorrhage, n=3-6. The arrow indicates the time point of injury/hemorrhage. Resus: Resuscitation period. B. Average HSP70 plasma levels during the individual experimental phases (baseline, early shock phase (t=1-25 min), late shock phase (30-60 min), resuscitation phase (resus)). S: Sham control. Average plasma levels for each animal were calculated as the mean of all plasma levels which were determined during each time period; data from A. P: Polytrauma only. H: Hemorrhage only. PH: Polytrauma plus hemorrhage. Boxes extend from the 25th to 75th percentile; the horizontal line shows the median. Error bars show the 10th and 90th percentile. Groups not sharing the same letter are significantly different (p<0.05) during each individual experimental phase. *: p<0.05 vs. baseline. $: p<0.05 vs. early shock period (1-25 min). #: p<0.05 vs. late shock period (30-60 min).

Comment in

References

    1. Keel M, Schregenberger N, Steckholzer U, et al. Endotoxin tolerance after severe injury and its regulatory mechanisms. J Trauma. 1996;41(3):430–437. discussion 437-438. - PubMed
    1. Majetschak M, Flach R, Heukamp T, et al. Regulation of whole blood tumor necrosis factor production upon endotoxin stimulation after severe blunt trauma. J Trauma. 1997;43(6):880–887. - PubMed
    1. Majetschak M, Flach R, Kreuzfelder E, et al. The extent of traumatic damage determines a graded depression of the endotoxin responsiveness of peripheral blood mononuclear cells from patients with blunt injuries. Crit Care Med. 1999;27(2):313–318. - PubMed
    1. Majetschak M, Borgermann J, Waydhas C, et al. Whole blood tumor necrosis factor-alpha production and its relation to systemic concentrations of interleukin 4, interleukin 10, and transforming growth factor-beta1 in multiply injured blunt trauma victims. Crit Care Med. 2000;28(6):1847–1853. - PubMed
    1. Ditschkowski M, Kreuzfelder E, Majetschak M, et al. Reduced B cell HLA-DR expression and natural killer cell counts in patients prone to sepsis after injury. Eur J Surg. 1999;165(12):1129–1133. - PubMed

Publication types