. 2011 Dec 1;51(11):2108-17.
doi: 10.1016/j.freeradbiomed.2011.09.011. Epub 2011 Sep 17.

Glutaredoxin 2 knockout increases sensitivity to oxidative stress in mouse lens epithelial cells

Affiliations

Glutaredoxin 2 knockout increases sensitivity to oxidative stress in mouse lens epithelial cells

HongLi Wu et al. Free Radic Biol Med. .

Abstract

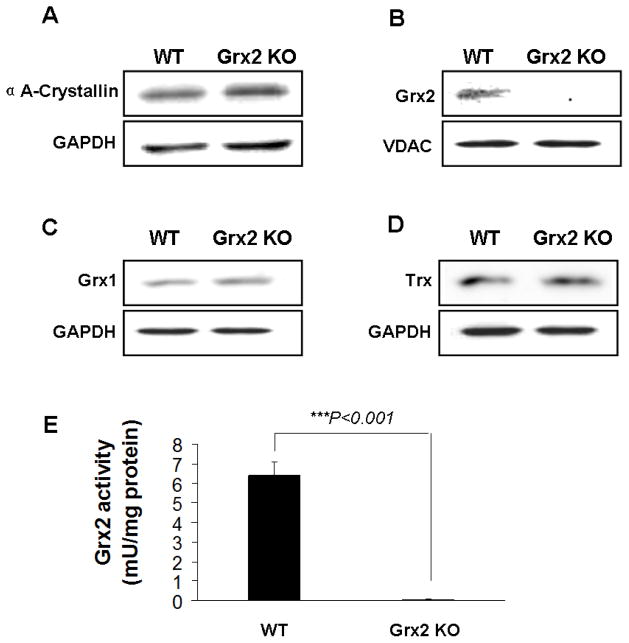
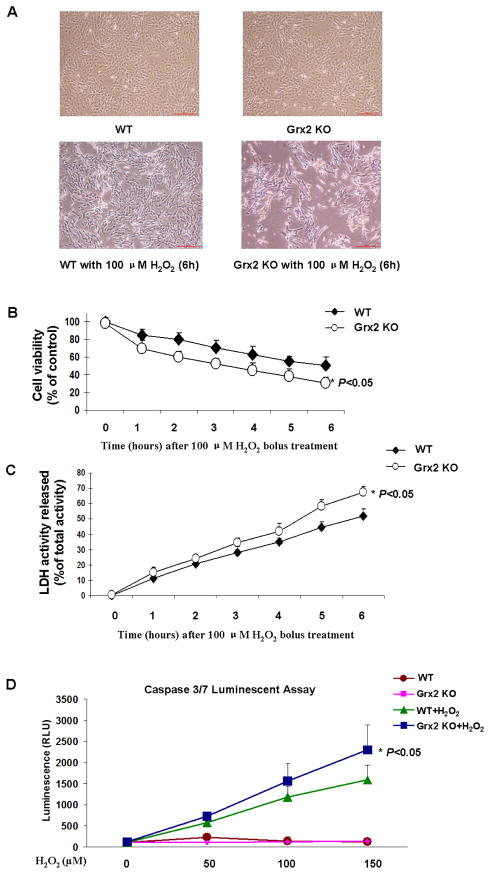
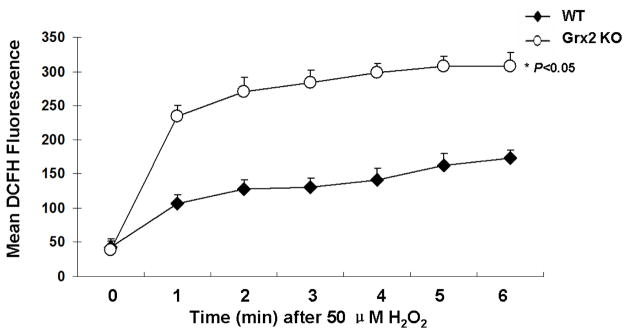
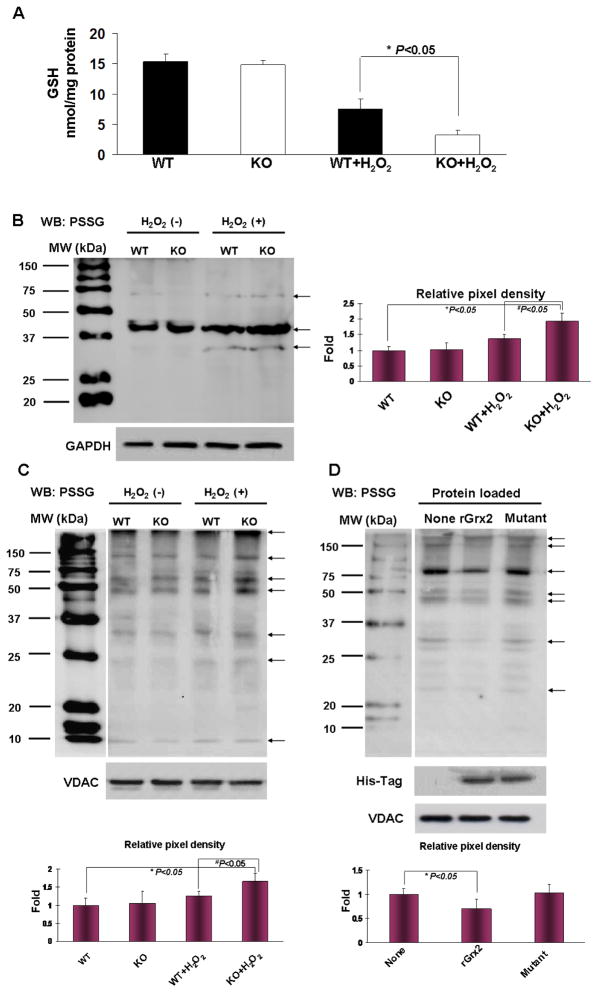
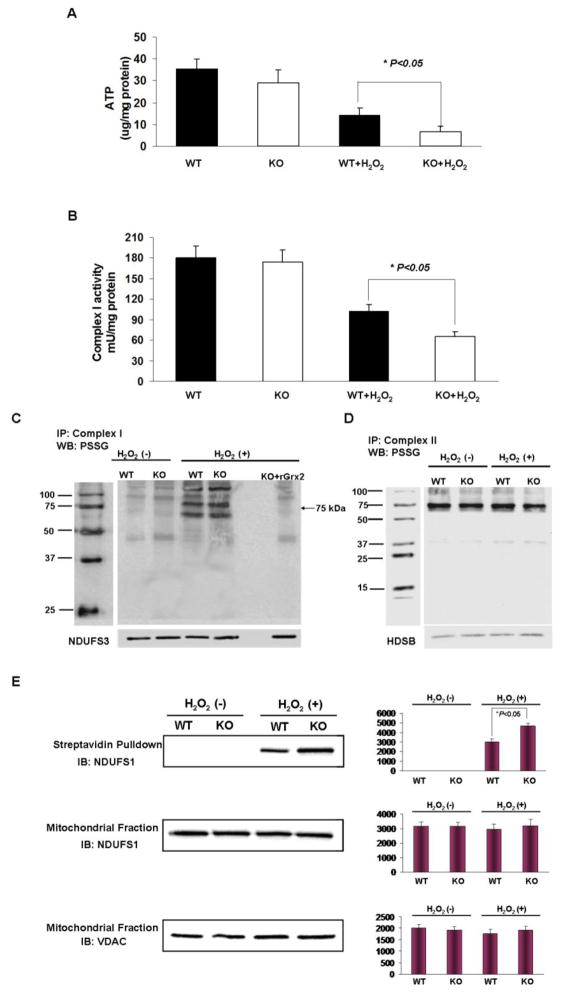
Glutaredoxin belongs to the oxidoreductase family, with cytosolic glutaredoxin 1 (Grx1) and mitochondrial glutaredoxin 2 (Grx2) isoforms. Of the two isozymes, the function of Grx2 is not well understood. This paper describes the effects of Grx2 deletion on cellular function using primary lens epithelial cell cultures isolated from Grx2 gene knockout (KO) and wild-type (WT) mice. We found that both cell types showed similar growth patterns and morphology and comparable mitochondrial glutathione pool and complex I activity. Cells with deleted Grx2 did not show affected Grx1 or thioredoxin expression but exhibited high sensitivity to oxidative stress. Under treatment with H(2)O(2), the KO cells showed less viability, higher membrane leakage, enhanced ATP loss and complex I inactivation, and weakened ability to detoxify H(2)O(2) in comparison with the WT cells. The KO cells had higher glutathionylation in the mitochondrial proteins, particularly the 75-kDa subunit of complex I. Recombinant Grx2 deglutathionylated complex I and restored most of its activity. We conclude that Grx2 has a function that protects cells against H(2)O(2)-induced injury via its peroxidase and dethiolase activities; particularly, Grx2 prevents complex I inactivation and preserves mitochondrial function.


Figures

Fig. 1
Fig. 1. Characterization of wild type (WT) and Grx2 knockout Grx2 KO) primary mouse lens epithelial cells (LEC)s
Primary mouse LECs were isolated from WT and Grx2 KO lens epithelial layers. (A) Expression of αA-crystallin in wild type and Grx2 knockout LECs. Whole cell lysates (40 μg) were obtained from wild type or Grx2 knockout mouse LECs and analyzed by immunoblot by using anti-αA- crystallin antibody. Glyceraldehyde 3-phosphate dehydrogenase (GAPDH) was used as a loading control. (B) Detection of Grx2 in WT and Grx2 KO mouse LECs. 40 μg of mitochondrial isolated from WT and Grx2 KO cells were analyzed by Western blot with anti-Grx2 antibody. Voltage-dependent anion channels (VDAC) was used as both a mitochondrial marker and loading control. (C) Expression of glutaredoxin 1 (Grx1) in WT and Grx2 KO LECs. 40 μg of whole cell lysates obtained from WT or Grx2 KO cells were analyzed by immunoblot by using anti-glutaredoxin antibody. GAPDH was used as a loading control. (D) Expression of thioredoxin (Trx) in WT or Grx2 KO LECs. 40 μg of whole cell lysates obtained from wild type or Grx2 knockout cells were analyzed by immunoblot by using anti-thioredoxin antibody. GAPDH was used as a loading control. (E) Grx2 activity in wild type and Grx2 knockout LECs. Mitochondrial fraction isolated from WT or Grx2 KO cells were used to detect Grx2 activity as described under “Materials and methods”. Error bars indicate S.D., n=3, *P<0.05 vs. WT.
Fig. 2
Fig. 2. Effect of H2O2 in wild type (WT) and Grx2 knockout (Grx2 KO) lens epithelial cells
(A) Comparison of the cell density and morphology after H2O2 treatment. WT and Grx2 Grx2 KO primary mouse LECs were treated with or without 100 μM H2O2 for 6 hrs. After treatment, cell morphology was observed under phase contrast microscopy. (B) Effect of H2O2 on cell viability in WT and Grx2 KO cells. WT and Grx2 KO primary mouse LECs were plated in 96-well plate (all normalized to 10,000 cells/well) and treated with or without 100 μM H2O2 at for indicated times. Cell viability in each time point was measured by adding WST-8 reagent and then the transmission was evaluated under 450 nm using a 96-well microplate reader. Error bars indicate S.D., n=3, *P<0.05 vs. WT treated with H2O2. (C) Effect of H2O2 on LDH release in WT and Grx2 KO cells. Wild type and Grx2 knockout primary mouse LECs were treated with or without 100 μM H2O2 at different time point from 0 to 6 hours. LDH activity was measured as described as under “Materials and methods”. Error bars indicate S.D., n=3, *P<0.05 vs. WT treated with H2O2. (D) Effect of H2O2 on caspase 3/7 activation in WT and Grx2 KO cells. Wild type and Grx2 knockout primary mouse LECs were plated in 96-well plate (all normalized to 10,000 cells/well) and treated with 0, 50, 100 and 150 μM H2O2, respectively for 6 hrs. Caspase 3/7 activity was measured by using luminogenic substrate containing the DEVD sequence. Error bars indicate S.D., n=3, *P<0.05 vs. WT treated with H2O2.
Figure 3
Figure 3. H2O2 detoxification in wild type and Grx2 knockout lens epithelail cells
Wild type (WT) and Grx2 knockout (Grx2 KO) primary mouse LECs were plated in 96-well plate (all normalized to 10,000 cells/well) and treated with PBS containing 50 μM DCFH-DA. After a baseline was acquired, 50 μM H2O2 was added to the cells and DCF fluorescence levels were determined at given time points. Error bars indicate S.D., n=6, *P<0.05 vs. WT.
Figure 4
Figure 4. Free GSH and glutathionylated proteins (PSSG) in wild type (WT) and Grx2 knockout (KO) lens epithelial cells after H2O2 treatment
(A) GSH level in WT and Grx2 KO lens epithelial cells (LECs). WT and Grx2 KO primary mouse LECs were treated with or without 100 μM H2O2 for 6 hrs. Cells were lysed in lysis buffer and GSH concentrations in cell lysates were determined using Ellman reagent described under “Material and methods”. Error bars indicate S.D., n=6, *P<0.05 vs. WT treated with H2O2. (B) PSSG levels in whole cell lysates in WT and Grx2 KO LECs. Wild type and Grx2 knockout were treated with or without 1 mM H2O2 for 30 min. Then the cells were lysed in lysis buffer and the total cell lysates were immunoblotted with anti-GSH (PSSG) antibody under non-reducing conditions. GAPDH was used as a loading control. The right panel depicts the relative pixel density of all the PSSG bands (see arrows) over GAPDH (with the untreated WT normalized to 1.0). Data presented are a typical representation of triplicate experiments. *P<0.05, vs. WT LECs. #P<0.05, vs WT LECs treated with 1 mM H2O2 for 30 min. (C) PSSG levels in mitochondrial fraction of WT and Grx2 KO cells. Cells in (B) were used for mitochondrial isolation and the mitochondrial extracts were used for Western blot (WB) detection for PSSG. Mitochondrial protein VDAC was used as a loading control. The bottom panel depicts the relative pixel density of all the PSSG bands (see arrows) over VDAC (with the untreated WT normalized to 1.0). Data presented are a typical representation of triplicate experiments. *P<0.05, vs. WT LECs. #P<0.05, vs WT LECs treated with 1 mM H2O2 for 30 min. (D) Deglutathionylation of mitochondrial PSSG with imported Grx2. Grx2 KO cells were imported with 20 μM purified wild type Grx2 recombinant protein (rGrx2), Grx2-C70S/C73S double mutated protein (Mutant). After 4 hours of incubation, the cells were treated with 1 mM H2O2 for 30 min. After treatment, the mitochondrial fraction of each group was analyzed for PSSG. His-Tag immunoblotting was done to verify the delivery of recombinant Grx2 protein. The bottom panel depicts the relative pixel density of all the PSSG bands (see arrows) over VDAC (with the KO LECs without import normalized to 1.0). Data presented are a typical representation of triplicate experiments. *P<0.05, vs. KO LECs treated with 1 mM H2O2 for 30 min.
Figure 5
Figure 5. Protective effect of Grx2 against complex I dysfunction induced by H2O2
(A) ATP level in wild type and Grx2 knockout LECs. Wild type (WT) and Grx2 knockout (Grx2 KO) primary mouse LECs were treated with or without 100 μM H2O2 for 6 hrs. ATP level in each group was determined using ATP assay kit. The data are expressed as mean±S.D., n=6, *P<0.05 vs. WT treated with H2O2. (B) Complex I activity in wild type and Grx2 knockout LECs. The mitochondrial lysate from (A) was used to detect complex I activity. The data are expressed as mean±S.D., n=6, *P<0.05 vs. WT treated with H2O2. (C) Glutathionylation and de-glutathionylation of complex I in wild type and Grx2 knockout mouse. Liver mitochondrial lysates (5 mg) isolated from WT or Grx2 KO mouse were incubated with or without 20 μM purified mouse Grx2 recombinant protein (rGrx2) and 5 mM GSH for 10 min. Then, mitochondrial lysates were treated with or without 1 mM H2O2 for 30 min. After treatment, mitochondrial lysates were washed twice with cold mitochondria isolation buffer. Agarose beads irreversibly cross-linked to complex I monoclonal antibodies were added. Immunocaptured complex I in each group was used for Western blot (WB) detection of PSSG. A specific antibody to 30 kDa subunit of complex I (NDUFS3) was used as a loading control. The position of 75 kDa subunit of complex 1 is indicated by an arrow. (D) Glutathionylation of complex II in wild type and Grx2 knockout mouse. Mitochondrial lysates were treated with or without 1 mM H2O2 for 30 min and complex II was pulled down by using complex II antibody. Immunocaptured complex II from each group was used for Western blot (WB) detection of PSSG. HDSB was used as a loading control. IP: mmunoprecipitation; MW: molecular weight (E) Wild type (WT) and Grx2 knockout (KO) primary mouse LECs were preloaded with Biogee for 1 hour. Then the cells were treated with or without 100 μM H2O2 for another 6 hrs. Streptavidin extracts from the mitochondrial proteins were resolved by SDS-PAGE and hybridized with NDUFS1, a specific antibody against 75 kDa subunit (upper panel). NDUFS1 protein level was detected in the mitochondria fraction (middile panel). VDAC was used as a loading control (lower panel). The bar graph with average pixel density for each western blot is shown. IB: Immunoblotting.

References

    1. Klaunig JE, Kamendulis LM. The role of oxidative stress in carcinogenesis. Annu Rev Pharmacol Toxicol. 2004;44:239–267. - PubMed
    1. Smith CD, Carney JM, Starke-Reed PE, Oliver CN, Stadtman ER, Floyd RA, Markesbery WR. Excess brain protein oxidation and enzyme dysfunction in normal aging and in Alzheimer disease. Proc Natl Acad Sci U S A. 1991;88:10540–10543. - PMC - PubMed
    1. Beatty S, Koh H, Phil M, Henson D, Boulton M. The role of oxidative stress in the pathogenesis of age-related macular degeneration. Surv Ophthalmol. 2000;45:115–134. - PubMed
    1. Lou MF. Redox regulation in the lens. Prog Retin Eye Res. 2003;22:657–682. - PubMed
    1. Gladyshev VN, Liu A, Novoselov SV, Krysan K, Sun QA, Kryukov VM, Kryukov GV, Lou MF. Identification and characterization of a new mammalian glutaredoxin (thioltransferase), Grx2. J Biol Chem. 2001;276:30374–30380. - PubMed

Publication types