. 2011 Oct 9;29(11):1005-10.
doi: 10.1038/nbt.1989.

Therapeutic siRNA silencing in inflammatory monocytes in mice

Affiliations

Therapeutic siRNA silencing in inflammatory monocytes in mice

Florian Leuschner et al. Nat Biotechnol. .

Abstract

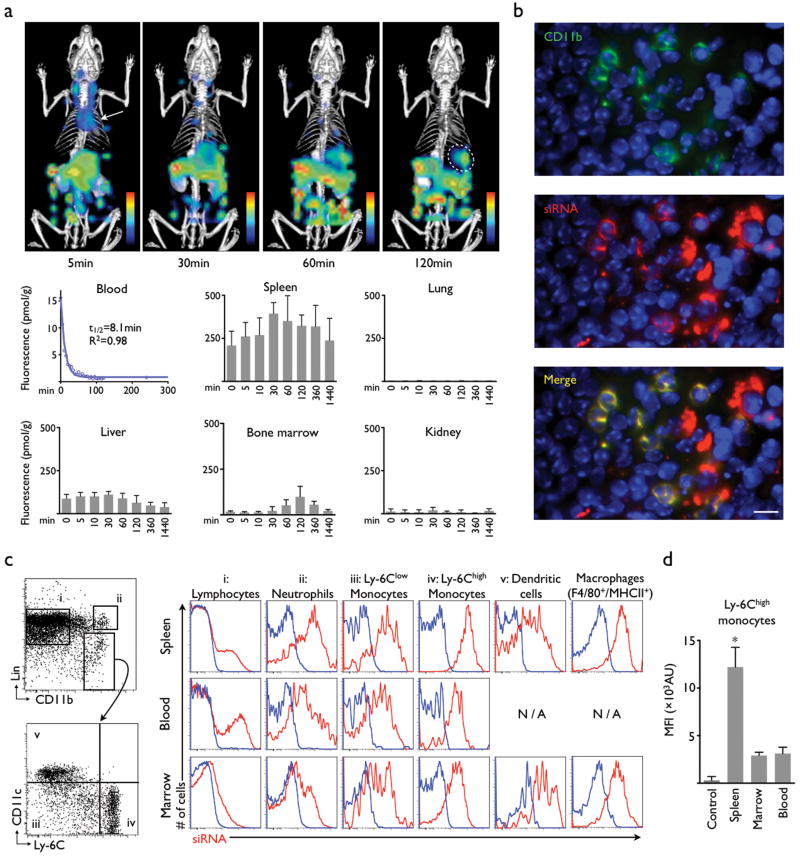
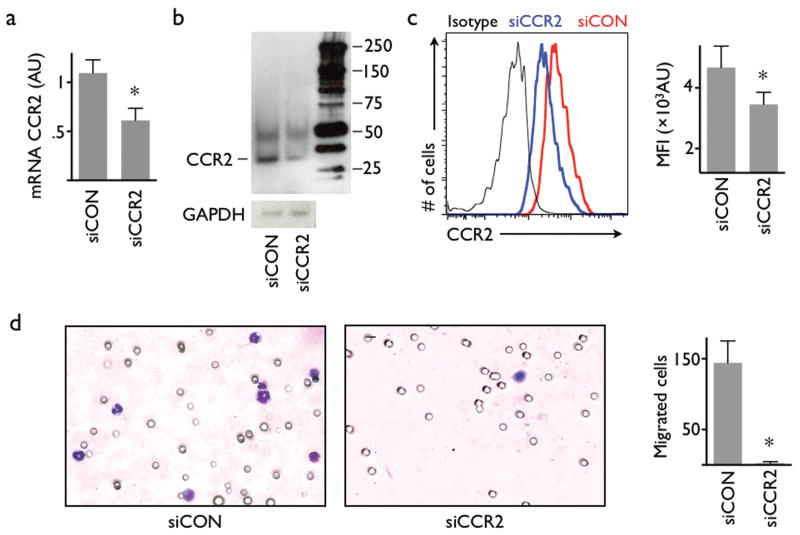
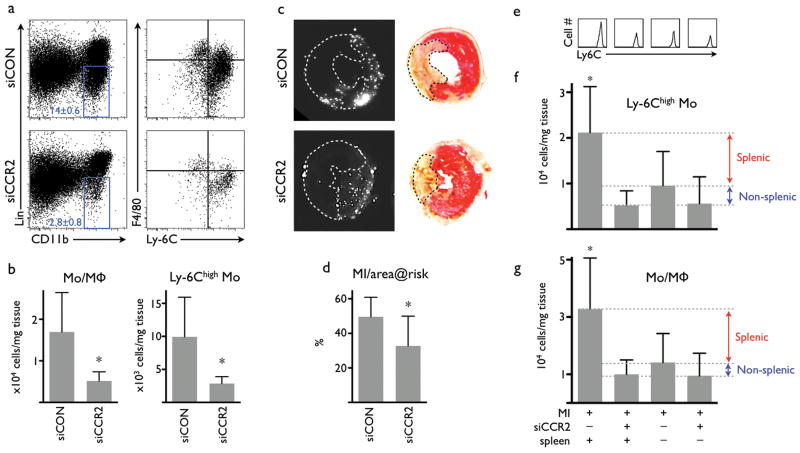
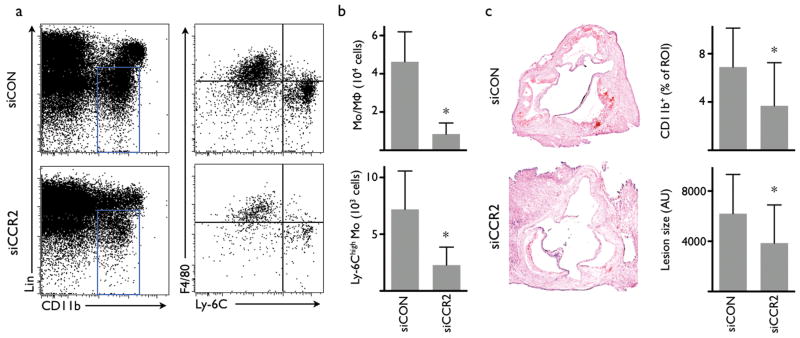
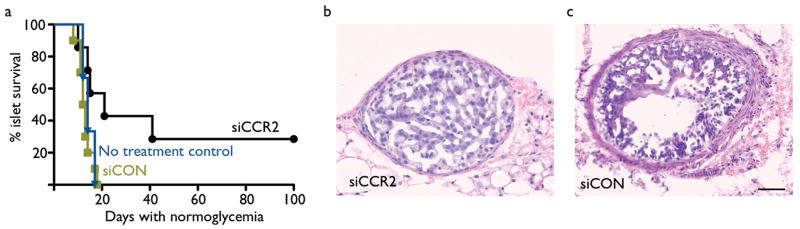
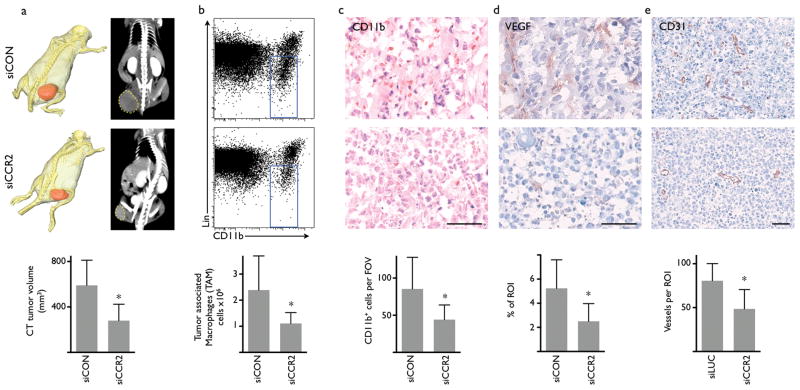
Excessive and prolonged activity of inflammatory monocytes is a hallmark of many diseases with an inflammatory component. In such conditions, precise targeting of these cells could be therapeutically beneficial while sparing many essential functions of the innate immune system, thus limiting unwanted effects. Inflammatory monocytes-but not the noninflammatory subset-depend on the chemokine receptor CCR2 for localization to injured tissue. Here we present an optimized lipid nanoparticle and a CCR2-silencing short interfering RNA that, when administered systemically in mice, show rapid blood clearance, accumulate in spleen and bone marrow, and localize to monocytes. Efficient degradation of CCR2 mRNA in monocytes prevents their accumulation in sites of inflammation. Specifically, the treatment attenuates their number in atherosclerotic plaques, reduces infarct size after coronary artery occlusion, prolongs normoglycemia in diabetic mice after pancreatic islet transplantation, and results in reduced tumor volumes and lower numbers of tumor-associated macrophages.


Figures

Figure 1
Figure 1. Nanoparticle-encapsulated siRNA distributes to leukocytes
(a) Dynamic FMT-CT biodistribution imaging of siRNA shows major uptake in the spleen (circle). The material is rapidly cleared from the blood pool (arrow) and excreted via the hepato-biliary route into bowel (n = 5). (b) Immunofluorescence microscopy of the splenic red pulp shows colocalization of siRNA (red), CD11b expression (green). The scale bar indicates 20μm. (c) Profiling by flow cytometry reveals strong uptake of siRNA into cells of the mononuclear phagocyte system in the bone marrow, blood and the spleen. Representative dot-plots on the left illustrate the gating strategy (lin: lineage markers). Histograms on the right illustrate the uptake of siRNA (red) in the respective cells (columns) and organs (rows). Blue indicates control fluorescence in cells harvested from non-injected mice. (d) Comparison of siRNA content in Ly-6Chigh monocytes retrieved from different organs (n = 3 mice per group). Mean ± SD, * P < 0.05.
Figure 2
Figure 2. Intravenous injection of nanoparticle-encapsulated siRNA results in knock down in monocytes
(a) PCR analysis of FACS-sorted splenic Ly-6Chigh monocytes after intravenous administration of nanoparticle-encapsulated siRNA targeting CCR2 (siCCR2). siCON: control siRNA treatment. n = 3 per group. (b) Western blot of Ly-6Chigh monocytes isolated from the spleen of mice that were either treated with siCCR2 or control. The reduced band in the siCCR2 lane confirms a lower expression of CCR2 receptor protein in splenic monocytes after intravenous treatment (experiment was done in triplicate, representative blot is cropped. The full length blot is presented in Supplementary Figure 6). (c) FACS analysis of CCR2 protein on splenic Ly-6Chigh monocytes. Representative histogram shows isotype antibody staining (black), control treatment (red) and siCCR2 treatment (blue). Bar graph of mean fluorescent intensity (MFI, y axis starts at mean fluorescence intensity of the isotype control; n = 6 per group). (d) Migration assay of sorted Ly-6Chigh monocytes using MCP-1 as chemoattractant. Cells were harvested from mice injected with either siCCR2 or control siRNA (n = 3 per group). Stained membranes on the left, bar graph shows enumeration of migrated cells. Mean ± SD, * P < 0.05.
Figure 3
Figure 3. Treatment with siCCR2 reduces ischemia reperfusion injury
(a) FACS of hearts 24 hours after ischemia reperfusion injury (IRI). Dot-plots show a reduction of monocytes/macrophages (blue gate) in the infarct tissue after siCCR2 treatment. Right column of dot plots displays subset analysis with a drastically reduced Ly-6Chigh monocyte population in the lower right quadrant. (b) Cell tissue numbers for monocytes/macrophages (Mo/MΦ, left) and for Ly-6Chigh monocytes (n = 9 per group). (c) Fluorescence reflectance images display the area at risk, which is void of microspheres injected during ischemia (left column). TTC staining of the same myocardial short axis slice (right column). The pale, unstained infarct is outlined by a dotted line. (d) Infarct size normalized to the non-perfused area at risk (n = 7-9 per group). (e-f) FACS of infarcts 24 hours after permanent coronary ligation. Spleen “minus” indicates removal of the spleen at time of myocardial infarction. (e) Histogram of Ly-6Chigh monocytes in infarcts. (f) Number of Ly-6Chigh monocytes in infarcts. (g) Number of monocytes/macrophages in infarcts. No statistically significant difference was detected between treatment groups (n = 4-8 per group). Mean ± SD, * P < 0.05.
Fig. 4
Fig. 4. Treatment with siCCR2 reduces inflammation in atherosclerotic lesions in apoE-/- mice
(a) FACS analysis of cell suspensions retrieved from aortas after 3 weeks of treatment with siRNA targeting CCR2 (siCCR2) or control siRNA treatment (siCON). (b) Number of monocytes and macrophages (Mo/MΦ) and Ly-6Chigh monocytes in the aortas of apoE-/- mice (n = 10 per group). (c) Immunohistochemical analysis of aortic roots for CD11b and lesion size (n = 8-14 per group). ROI: region of interest. AU: arbitrary units. Mean ± SD, * P < 0.05.
Fig. 5
Fig. 5. siCCR2 treatment prolongs survival of pancreatic islet allografts
Diabetic C57/BL/6 mice received BALB/c islets. (a) Survival curve of pancreatic islet transplants in untreated control (blue), siRNA control treated (green) and siCCR2 (black) treated recipients. Rejection was defined as the return of hyperglycemia (blood glucose level >200 mg/dl on two consecutive measurements, n = 7-10 per group). P < 0.05. (b) H&E histology of a transplanted islet from a mouse treated with siCCR2. (c) Rejected islet from a control siRNA treated mouse. The scale bar indicates 50μm.
Figure 6
Figure 6. Treatment with siCCR2 reduces tumor size and the number of tumor-associated macrophages (TAM)
(a) Tumor size measured by X-ray CT. Representative images from mice on day 10 after implantation of EL4-tumors (n = 7 per group). Top row displays cohort treated with control siRNA (siCON), bottom row shows siCCR2 treatment. The three-dimensional CT reconstruction shows tumor in red pseudocolor. (b) FACS analysis of tumors with monocyte/macrophage gate (blue) after treatment with control siRNA (top) or siCCR2 (n = 5 per group). (c-e) Immunohistochemical evaluation of tumors for myeloid cells (c, CD11b), vascular endothelial growth factor (d, VEGF) and vessel density (e, CD31). The scale bar indicates 50μm. Mean ± SD, * P < 0.05, n = 7 per group.

Comment in

References

    1. Charo IF, Ransohoff RM. The many roles of chemokines and chemokine receptors in inflammation. N Engl J Med. 2006;354:610–621. - PubMed
    1. Gordon S, Taylor PR. Monocyte and macrophage heterogeneity. Nat Rev Immunol. 2005;5:953–964. - PubMed
    1. Geissmann F, et al. Development of monocytes, macrophages, and dendritic cells. Science. 2010;327:656–661. - PMC - PubMed
    1. Serbina NV, Pamer EG. Monocyte emigration from bone marrow during bacterial infection requires signals mediated by chemokine receptor CCR2. Nat Immunol. 2006;7:311–317. - PubMed
    1. Gu L, et al. Absence of monocyte chemoattractant protein-1 reduces atherosclerosis in low density lipoprotein receptor-deficient mice. Mol Cell. 1998;2:275–281. - PubMed

Publication types

MeSH terms