. 2011 Oct 9;43(11):1147-53.
doi: 10.1038/ng.971.

A primary microcephaly protein complex forms a ring around parental centrioles

Affiliations

A primary microcephaly protein complex forms a ring around parental centrioles

Joo-Hee Sir et al. Nat Genet. .

Abstract

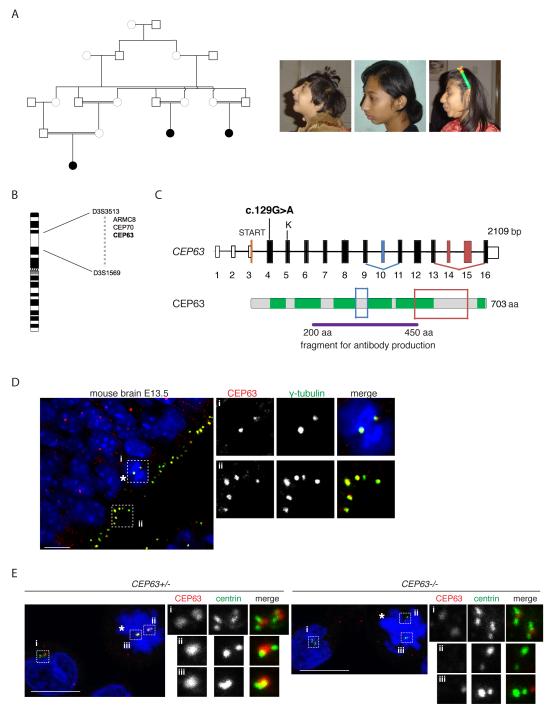
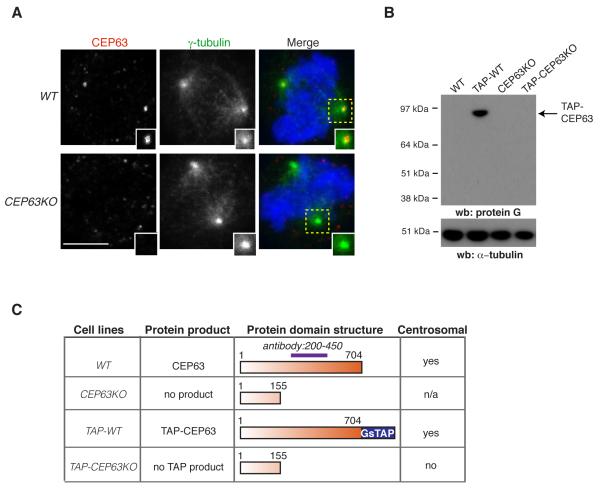
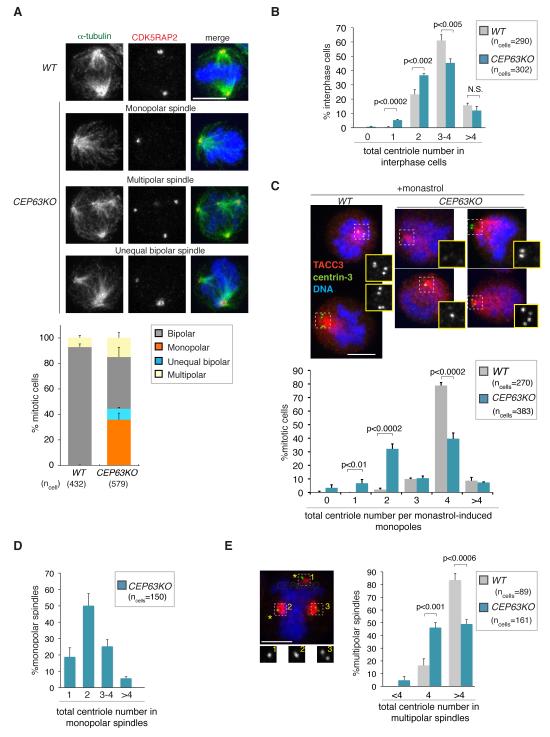
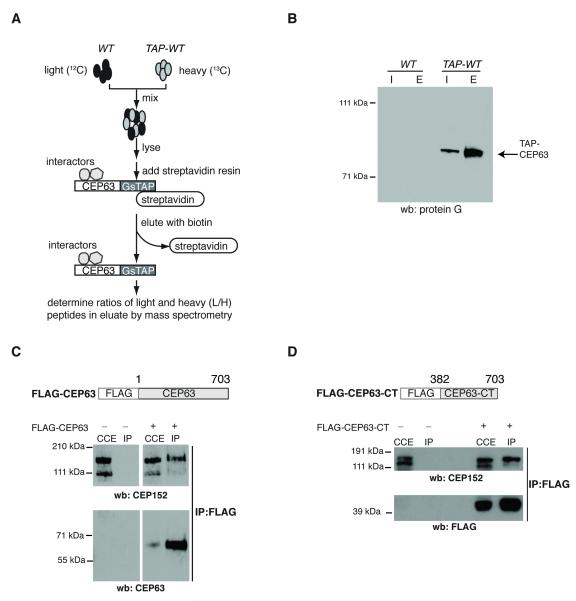
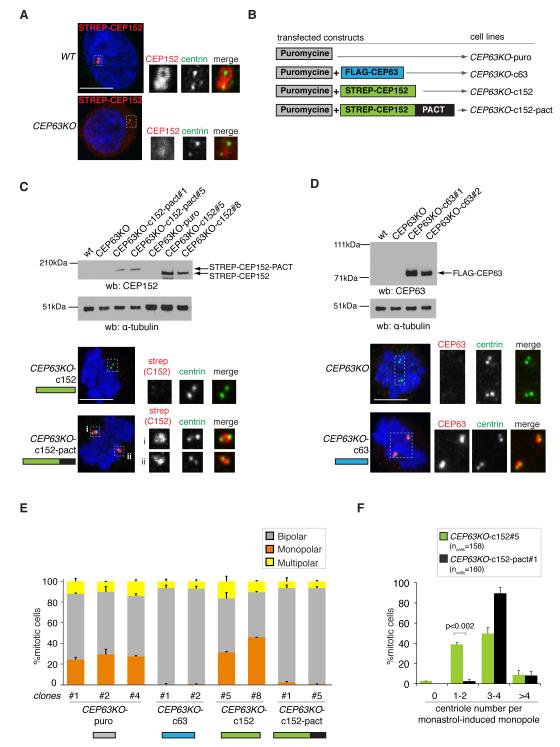
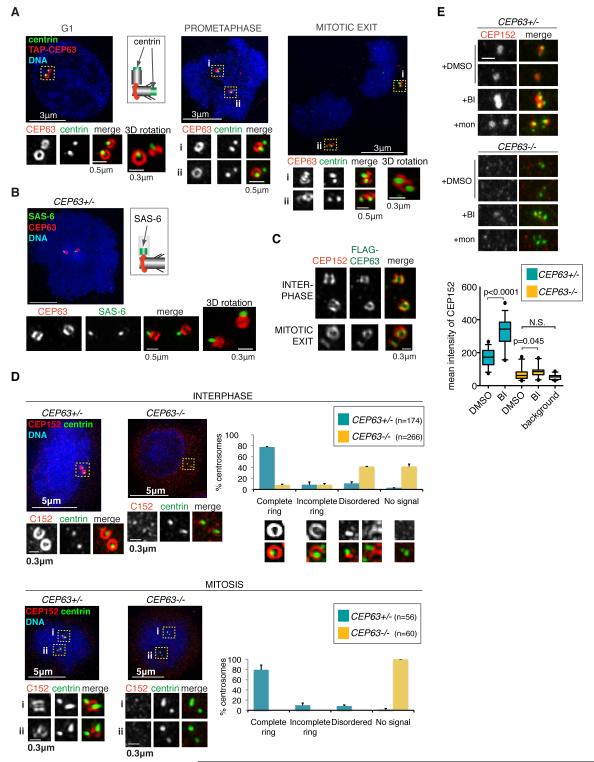
Autosomal recessive primary microcephaly (MCPH) is characterized by a substantial reduction in prenatal human brain growth without alteration of the cerebral architecture and is caused by biallelic mutations in genes coding for a subset of centrosomal proteins. Although at least three of these proteins have been implicated in centrosome duplication, the nature of the centrosome dysfunction that underlies the neurodevelopmental defect in MCPH is unclear. Here we report a homozygous MCPH-causing mutation in human CEP63. CEP63 forms a complex with another MCPH protein, CEP152, a conserved centrosome duplication factor. Together, these two proteins are essential for maintaining normal centrosome numbers in cells. Using super-resolution microscopy, we found that CEP63 and CEP152 co-localize in a discrete ring around the proximal end of the parental centriole, a pattern specifically disrupted in CEP63-deficient cells derived from patients with MCPH. This work suggests that the CEP152-CEP63 ring-like structure ensures normal neurodevelopment and that its impairment particularly affects human cerebral cortex growth.


Figures

Fig.1
Fig.1. Identification of a MCPH-causing mutation in the CEP63 gene
(A) Schematic diagram shows simplified pedigree. Filled in circles indicate individuals with MCPH. Only the closest link between family members is depicted. Pictures of three afflicted individuals are shown on right. (B) The three affected individuals share only one region that was concordantly homozygous in chromosome 3. The region was defined by heterozygous allele results for the markers D3S3513 at 137cM/121Mb and D3S1569 at 158cM/145Mb. The three candidate genes sequenced are shown within the linkage interval. (C) Exons of CEP63 gene are shown as bars; solid bars are translated. There is a single CpG island for the gene with transcription starting in exon 3. The position of the nonsense mutation c.129G>A is located in exon 4. A predicted Kozak sequence downstream of the mutation is shown (labelled as ‘K’). Alternatively spliced exons are shown in blue and red (see Supplementary Fig. 1A). CEP63 protein is shown with six predicted coiled-coil domains marked in green. Framed areas correspond to differentially spliced regions. The CEP63 antibody was raised against a recombinant fragment of CEP63 shown. (D) CEP63 protein expression in mouse cerebral cortex neuroepithelium at E13.5. Mitotic cell is marked with asterisk. Magnified views of framed areas are shown on right. Samples were co-stained with antibodies against CEP63 (red in merge) and the centrosomal protein γ-tubulin (green in merge). DNA is in blue. (E) CEP63 protein expression in parent-of-patient (CEP63+/−) and patient (CEP63−/−) lymphocytes. Mitotic cells are marked with asterisks. Magnified views of centrosomes are shown on right. Cells were co-stained with antibodies against CEP63 (red in merge) and the centriolar protein, centrin-3 (green in merge). DNA is in blue. Scale bars=10μm.
Fig.2
Fig.2. Disruption of the centrosomal gene CEP63 in vertebrate cells
(A) WT and CEP63KO DT40 cells were co-stained with antibodies against CEP63 (red in merge) and γ-tubulin (green in merge). Magnified views of framed areas are shown in insets. DNA is blue. Scale bar=5μm. (B) Western blots of cytoplasmic cell extracts (CCE) from WT and gene-disrupted DT40 cell lines were probed with protein G antibodies. TAP cell lines contain in-frame GsTAP tag in their CEP63 alleles. α-tubulin serves as loading control. (C) Summary of the localisation and expression of tagged and truncated CEP63 products in the DT40 cell lines specified. n/a: the antibody epitope is largely destroyed in predicted protein product.
Fig.3
Fig.3. CEP63 is required for maintaining normal centrosome numbers
(A) Examples for mitotic spindle defects of CEP63KO DT40 cells are shown. Cells are stained with antibodies against the centrosome marker CDK5RAP2 (red in merge) and α-tubulin (green in merge). DNA is in blue. Graph shows quantification of spindle phenotypes (n=3). Scale bars=5μm. (B) Graph shows number of centrioles in interphase WT and CEP63KO DT40 cells (n=3). Antibodies against centrin-3 were used for experiment. (C) Graph shows number of centrioles in monastrol-induced monopoles of WT and CEP63KO DT40 cells (n=3). Note that centriole numbers 1 and 3 could sometimes reflect insufficient spatial resolution of engaged centriole pairs. Examples for CEP63KO monopoles with different centriole numbers are shown; cells were co-stained with antibodies against the spindle pole marker TACC3 (red in merge) and centrin-3 (green in merge). DNA is in blue. Magnified views of centrin-3 staining in framed areas are shown in insets. Similar results were obtained using polyglutamylated tubulin as centriole marker; 0-2 centrioles were present in 42%, 3-4 centrioles in 52% and >4 centrioles in 6% of cells (100 CEP63KO mitotic cells). (D) Graph shows number of centrioles in untreated monopolar CEP63KO spindles (n=3). Antibodies against centrin-3 were used for experiment. (E) Graph shows number of centrioles in mitotic cells with multipolar spindles (n=3). On the left an example for CEP63KO multipolar spindle is shown with two singlet centrioles (asterisks) at spindle poles. Cell was co-stained with antibodies against the spindle pole marker TACC3 (red in merge) and centrin-3 (green in merge). DNA is in blue. Magnified views of centrin-3 staining in framed areas are shown in insets. Scale bars=5μm. Bars in graphs correspond to mean±standard deviation (s.d.). p values were obtained by two-tailed, unpaired Student t test. N.S.=not significant.
Fig.4
Fig.4. CEP63 forms a protein complex with CEP152
(A) Diagram illustrates experimental design to identify CEP63-interacting proteins. (B) Western blot shows an example for single step purification of GsTAP-tagged CEP63 protein. Cell lysates of WT or TAP-WT DT40 cells (Input=I) were incubated with streptavidin-agarose resin. Bound proteins were eluted from resin with biotin (Eluate=E). Immunoblot was probed with protein G antibodies to detect GsTAP-tagged CEP63. (C) Cytoplasmic cell extracts (CCE) were prepared from HeLa cells that were mock transfected (−) or transfected with FLAG-CEP63 (+). Anti-FLAG antibodies were used for immunoprecipitation (IP). Immunoblots were probed with antibodies against CEP63 and CEP152, as marked. (D) Cytoplasmic cell extracts (CCE) were prepared from HeLa cells that were mock transfected (−) or transfected with FLAG-CEP63-CT (+). Anti-FLAG antibodies were used for immunoprecipitation (IP). Immunoblots were probed with antibodies against CEP152 and FLAG, as marked.
Fig.5
Fig.5. CEP63-dependent centrosomal accumulation of CEP152 maintains normal centrosome numbers
(A) Localisation of STREP-tagged human CEP152 in transfected WT and CEP63KO DT40 cells. Magnified views of framed areas are shown in panels below. Cells are co-stained with antibodies against centrin-3 (green in merge) and CEP152 (red in merge). (B) Outline of constructs that were transfected into CEP63KO DT40 cells to derive cell lines stably expressing transgenes. (C) Cytoplasmic cell extracts of CEP63KO-derived DT40 cell lines (nomenclature as in B) were immunoblotted with antibodies against CEP152 and as a loading control, α-tubulin. Below mitotic cells co-stained with antibodies against centrin-3 (green in merge) and strep-tag II (red in merge) are shown. Magnified views of framed areas are shown. DNA is in blue. (D) Cytoplasmic cell extracts of CEP63KO-derived DT40 cell lines (nomenclature as in B) were immunoblotted with antibodies against CEP63 and as a loading control, α-tubulin. Below mitotic cells co-stained with antibodies against centrin-3 (green in merge) and CEP63 (red in merge) are shown. Magnified views of framed areas are shown. DNA is in blue. (E) Graph depicts quantification of spindle phenotypes in CEP63KO-derived DT40 cell lines (nomenclature as in B; n=2; >350 mitotic cells per clone). (F) Graph depicts number of centrioles in monastrol-induced monopoles of CEP63KO-c152 or CEP63KO-c152-pact DT40 cell lines (nomenclature as in B; n=2). Bars in graphs correspond to mean±s.d. p values were obtained by two-tailed, unpaired Student t test. Scale bars=5μm.
Fig.6
Fig.6. CEP63 and CEP152 form a ring around parental centrioles, a structure disrupted in CEP63−/− patient cells
(A) 3D-SIM images are shown of TAP-WT DT40 cells co-stained with antibodies against protein G (recognises TAP-CEP63; red in merge) and centrin-3 (green in merge) antibodies. Each centrosome is shown at high magnification with separate images depicting protein G (top panels) and centrin-3 (middle panels) stainings. Specific cell cycle stages are stated. All images are maximum projections apart from those referred to as 3D rotations. The latter represent alternative views of centrioles (generated by rotations of 3D volumes) to highlight particular features. Schematic shows relative positions of centrin and CEP63 staining. (B) 3D-SIM image of CEP63+/− human lymphocyte co-stained with antibodies against CEP63 (green in merge) and the daughter centriole marker, SAS-6 (red in merge). Schematic shows relative positions of SAS-6 and CEP63 staining. (C) HeLa cells stably expressing FLAG-CEP63 were co-stained with antibodies against FLAG (green in merge) and CEP152 (red in merge). 3D-SIM images of centrosomes are shown. (D) 3D-SIM images of interphase (top) and mitotic (bottom) CEP63+/− and CEP63−/− human lymphocytes are shown. Cells were co-stained with antibodies against CEP152 (red in merge) and centrin-3 (green in merge). DNA is in blue. Framed areas are shown in higher magnification with corresponding CEP152 (left panels) and centrin-3 (middle panels) signal. Graphs on the right show percentages of CEP63+/− and CEP63−/− centrosomes with specific CEP152 localisation pattern (n=2). (E) CEP63+/− and CEP63−/− human lymphocytes were treated with DMSO, PLK1 inhibitor BI-2536 (BI) or monastrol (mon) for 90 minutes prior to fixation. Cells were co-stained with antibodies against CEP152 (red in merge) and centrin-3 (green in merge). Examples for centrosomes from individual mitotic cells are shown. Note that mon and BI induce monoastral spindle, whereas those in DMSO remain bipolar. Scale bar=0.5μm. Distribution of mean intensities of centrosomal CEP152 signal in patient cells is illustrated in graph. Number of centrosomes scored: CEP63+/−: n=30 DMSO- and n=38 BI-treated; CEP63−/−: n=26 DMSO- and n=24 BI-treated. Background CEP152 signal was measured in areas of CEP63−/− cells that do not contain centrosomes (n=26). Box plots: length of whiskers is at 5th and 95th percentiles, the box shows interquartile (25-75) range and horizontal line represents the median. p values were obtained by two-tailed, unpaired Student t test. N.S.=not significant.

References

    1. Guernsey DL, et al. Mutations in centrosomal protein CEP152 in primary microcephaly families linked to MCPH4. Am J Hum Genet. 87:40–51. - PMC - PubMed
    1. Jackson AP, et al. Identification of microcephalin, a protein implicated in determining the size of the human brain. Am J Hum Genet. 2002;71:136–42. - PMC - PubMed
    1. Bond J, et al. ASPM is a major determinant of cerebral cortical size. Nat Genet. 2002;32:316–20. - PubMed
    1. Bond J, et al. A centrosomal mechanism involving CDK5RAP2 and CENPJ controls brain size. Nat Genet. 2005;37:353–5. - PubMed
    1. Kumar A, Girimaji SC, Duvvari MR, Blanton SH. Mutations in STIL, encoding a pericentriolar and centrosomal protein, cause primary microcephaly. Am J Hum Genet. 2009;84:286–90. - PMC - PubMed