Comparative Study
. 2011 Sep 11;8(10):821-7.
doi: 10.1038/nmeth.1699.

Proteomic and phosphoproteomic comparison of human ES and iPS cells

Affiliations
Comparative Study

Proteomic and phosphoproteomic comparison of human ES and iPS cells

Douglas H Phanstiel et al. Nat Methods. .

Abstract

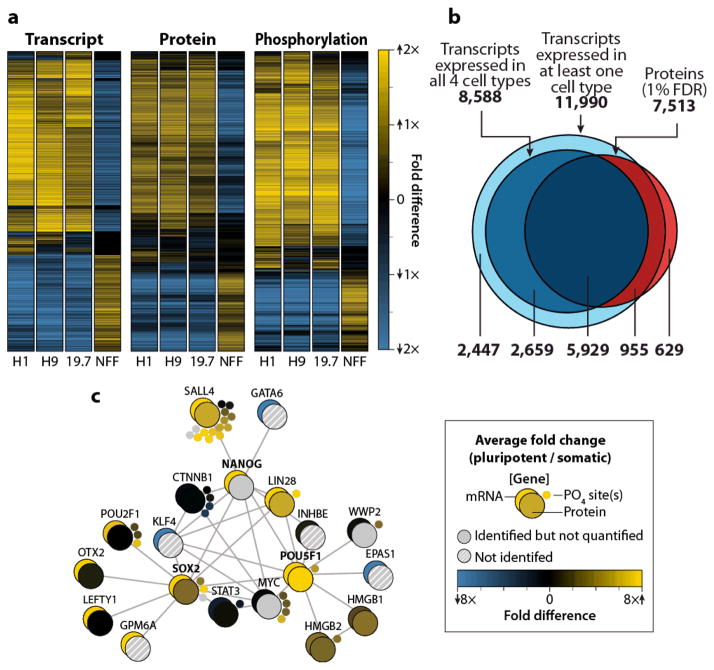
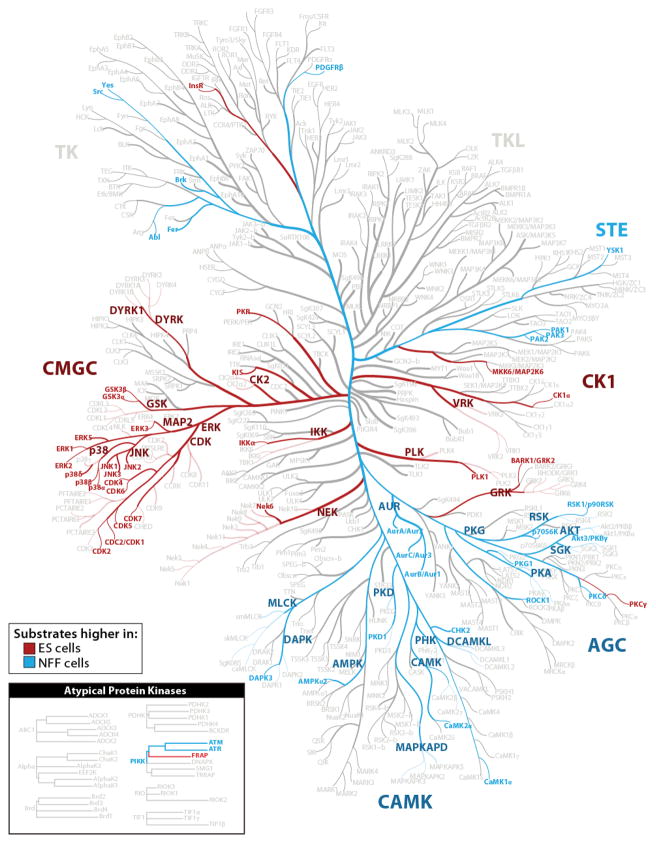
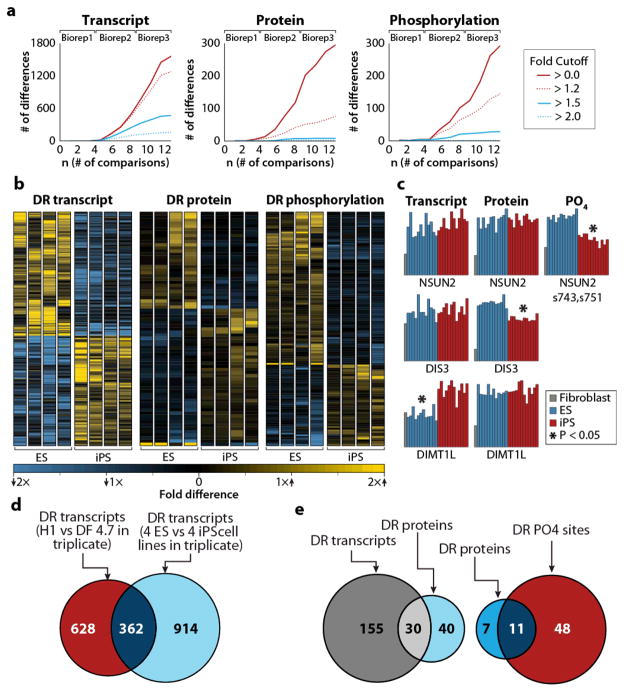
Combining high-mass-accuracy mass spectrometry, isobaric tagging and software for multiplexed, large-scale protein quantification, we report deep proteomic coverage of four human embryonic stem cell and four induced pluripotent stem cell lines in biological triplicate. This 24-sample comparison resulted in a very large set of identified proteins and phosphorylation sites in pluripotent cells. The statistical analysis afforded by our approach revealed subtle but reproducible differences in protein expression and protein phosphorylation between embryonic stem cells and induced pluripotent cells. Merging these results with RNA-seq analysis data, we found functionally related differences across each tier of regulation. We also introduce the Stem Cell-Omics Repository (SCOR), a resource to collate and display quantitative information across multiple planes of measurement, including mRNA, protein and post-translational modifications.


Conflict of interest statement

Declaration of interests

J.A.T. is a founder, stockowner, consultant and board member of Cellular Dynamics International (CDI), and serves as scientific advisor to and has financial interests in Tactics II Stem Cell Ventures.

Figures

Figure 1
Figure 1. Figures of merit for peptide identification and quantitation
(a) Peptide identifications as a function of precursor and product mass tolerance. We performed liquid chromatography tandem mass spectrometry for each combination of dissociation method and mass analyzer. We searched data using a range of fragment ion tolerances ranging from 0.01 to 5.0 Daltons, filtered results by precursor mass tolerances ranging from 0.5 to 1,000 ppm, and filtered identifications to a achieve 1%FDR. We performed experiments in triplicate and averaged the results. The number of peptide spectrum matches (PSM) is proportional to circle size while unique peptides are represented by circle color. (b) We used permutation testing and the data from the 4-plex experiment to test the benefit of interference filtering. R2 values for all peptides in each protein were calculated as a metric for quality of quantitation. The median R2 increases from 0.70 (red arrow) to 0.82 (blue arrow) with filtering. Since random removal of spectra also increases R2 values, we used permutation testing to test the statistical significance of the increase in R2 value resulting from interference filtering. By fitting a Gaussian curve to the distribution we estimated the statistical significance of the increase in R2 due to interference filtering (P = 3.16 × 10⁻¹⁶). (c) Characterization of iTRAQ quantitation. Each circle represents reporter ion intensities for a single protein mixed in the indicated ratios.
Figure 2
Figure 2. A transcriptomic, proteomic and phosphoproteomic comparison of two ES (H1 and H9), one iPS (19.7), and one fibroblast (NFF) line
(a) Heatmaps depicting all quantified transcripts, proteins, and phosphorylation sites. Values were median normalized. (b) The overlap between transcripts and proteins detected in the 4-plex experiment. We considered transcripts present if the reads per kilobase of exon per million mapped reads (RPKM) value was greater than one for all four cell types while we determined protein identification via P-value filtering (1% FDR). (c) Cytoscape schematic of mRNA, protein, and phosphorylation quantitation from the 4-plex experiment for genes known to interact with NANOG, SOX2, or POU5F1 (STRING database, confidence score > 0.90).
Figure 3
Figure 3. Kinase substrate analysis
Adapted from Manning et al.. We predicted potential kinases for every phosphorylation site using the Group-based Prediction system. We applied Fisher’s exact test (followed by Benjamini-Hochberg adjustment) to test for enrichment of kinase substrates in sets of phosphorylation sites that were changing by more than two-fold between ES and NFF cells kinase substrates enriched in ES cells are highlighted in red (P < 0.05). Kinase substrates enriched in ES cells are highlighted in blue (P < 0.05).
Figure 4
Figure 4. Comparison of four ES and four iPS cell lines
(a) Differentially regulated transcripts, proteins, and phosphorylation sites are shown as a function of the number of comparisons. We performed differential expression analysis using subsets of the data. For example, the n = 2 value reflects the number of differences detected from comparing just two ES lines and two iPS lines without biological replicate whereas n = 12 represents the differences detected from comparing all four ES lines and all four iPS lines in biological triplicate. The number of differentially regulated elements for a given fold-difference is indicated by different colors. (b) Heatmaps depicting differentially regulated transcripts, proteins, and phosphorylation sites (P < 0.05, Student’s t-test, with Benjamini-Hochberg correction). Only transcripts exhibiting at least a 1.5-fold difference and protein and phosphorylation sites exhibiting at least a 1.2-fold difference are shown. (c) Randomly selected examples of differentially regulated transcripts, proteins, and phosphorylation sites. Asterisks indicate statistically significant differences between ES and iPS cells. (d) Differentially regulated transcripts detected based on either a comparison between biological triplicates of H1 and DF4.7 cell lines (blue) or a comparison of biological triplicates of all four ES and all four iPS cell lines (red). (e) The overlap between differentially regulated proteins and transcripts (left) and differentially regulated proteins and phosphorylation sites (right). Only genes with both a quantified protein and transcript were included. Only genes with both a quantified protein and phosphorylation site were included.

Comment in

References

    1. Yu JY, et al. Human Induced Pluripotent Stem Cells Free of Vector and Transgene Sequences. Science. 2009;324:797–801. - PMC - PubMed
    1. Takahashi K, et al. Induction of pluripotent stem cells from adult human fibroblasts by defined factors. Cell. 2007;131:861–872. - PubMed
    1. Yu JY, et al. Induced pluripotent stem cell lines derived from human somatic cells. Science. 2007;318:1917–1920. - PubMed
    1. Chin MH, et al. Induced pluripotent stem cells and embryonic stem cells are distinguished by gene expression signatures. Cell Stem Cell. 2009;5:111–123. - PMC - PubMed
    1. Guenther MG, et al. Chromatin structure and gene expression programs of human embryonic and induced pluripotent stem cells. Cell Stem Cell. 2010;7:249–257. - PMC - PubMed

Publication types