. 2011 Dec;51(4):467-76.
doi: 10.1007/s10858-011-9575-4. Epub 2011 Oct 8.

Hydrogen exchange during cell-free incorporation of deuterated amino acids and an approach to its inhibition

Affiliations

Hydrogen exchange during cell-free incorporation of deuterated amino acids and an approach to its inhibition

Marco Tonelli et al. J Biomol NMR. 2011 Dec.

Abstract

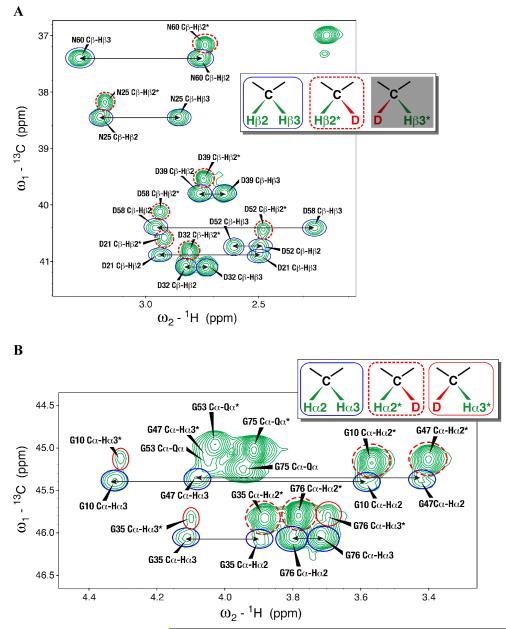
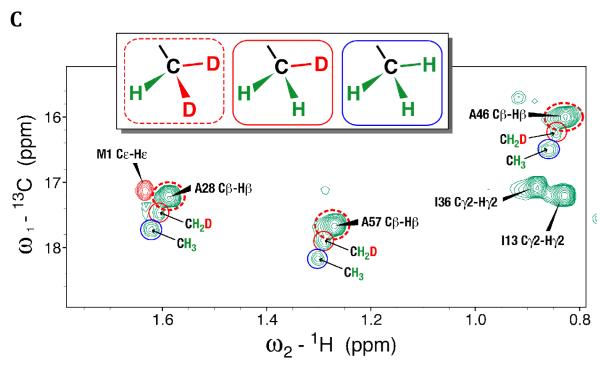
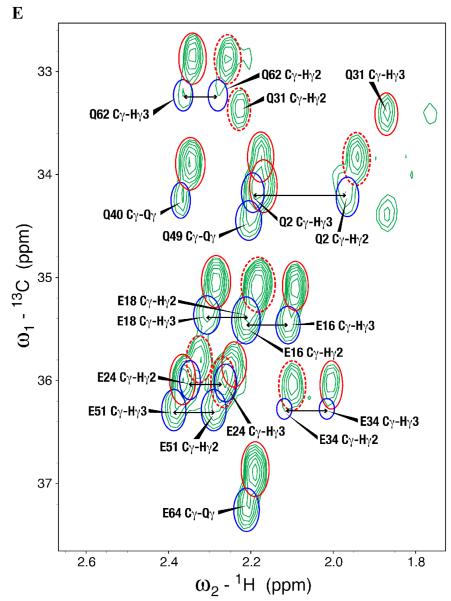
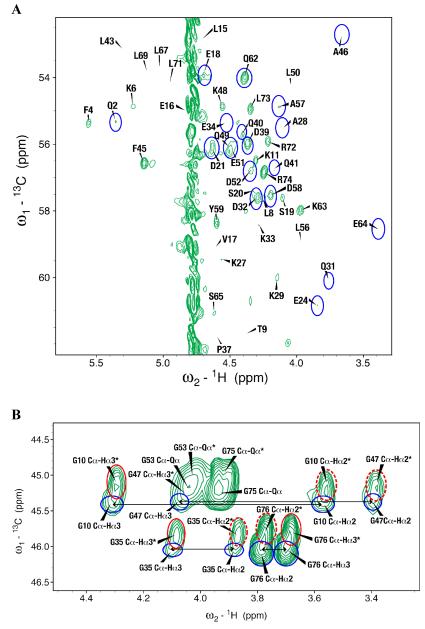
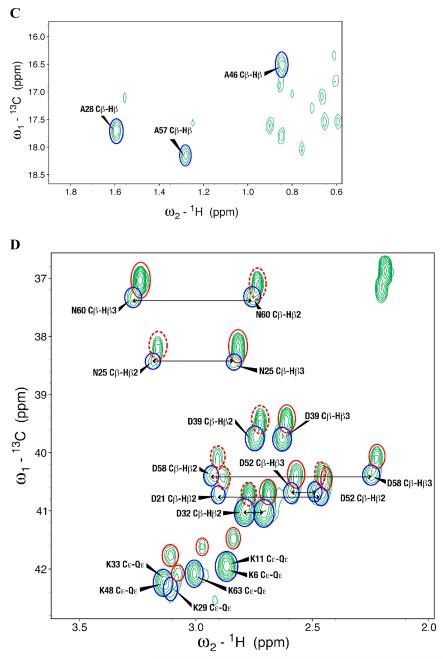
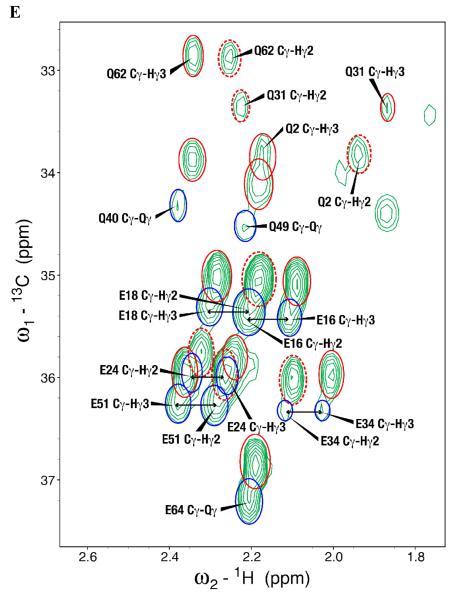
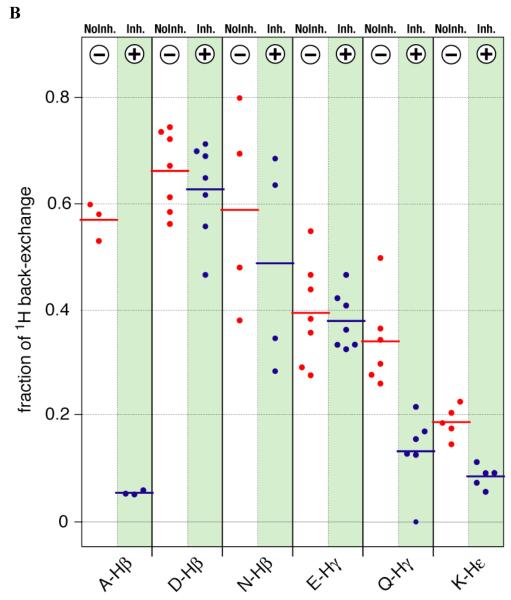
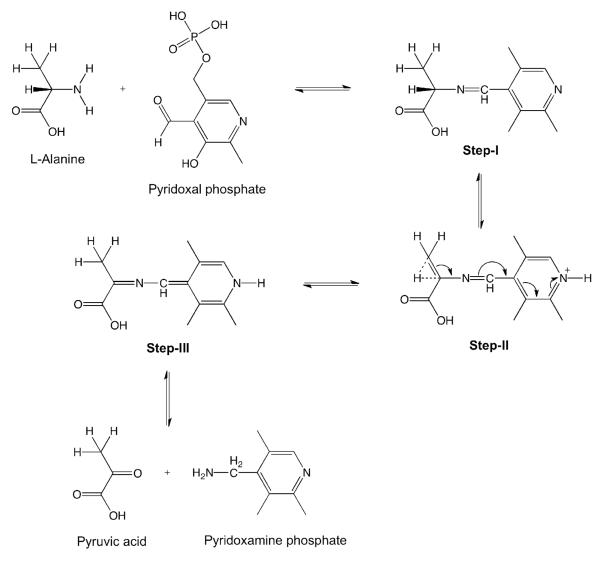
Perdeuteration, selective deuteration, and stereo array isotope labeling (SAIL) are valuable strategies for NMR studies of larger proteins and membrane proteins. To minimize scrambling of the label, it is best to use cell-free methods to prepare selectively labeled proteins. However, when proteins are prepared from deuterated amino acids by cell-free translation in H(2)O, exchange reactions can lead to contamination of (2)H sites by (1)H from the solvent. Examination of a sample of SAIL-chlorella ubiquitin prepared by Escherichia coli cell-free synthesis revealed that exchange had occurred at several residues (mainly at Gly, Ala, Asp, Asn, Glu, and Gln). We present results from a study aimed at identifying the exchanging sites and level of exchange and at testing a strategy for minimizing (1)H contamination during wheat germ cell-free translation of proteins produced from deuterated amino acids by adding known inhibitors of transaminases (1 mM aminooxyacetic acid) and glutamate synthetase (0.1 mM L: -methionine sulfoximine). By using a wheat germ cell-free expression system, we produced [U-(2)H, (15)N]-chlorella ubiquitin without and with added inhibitors, and [U-(15)N]-chlorella ubiquitin as a reference to determine the extent of deuterium incorporation. We also prepared a sample of [U-(13)C, (15)N]-chlorella ubiquitin, for use in assigning the sites of exchange. The added inhibitors did not reduce the protein yield and were successful in blocking hydrogen exchange at C(α) sites, with the exception of Gly, and at C(β) sites of Ala. We discovered, in addition, that partial exchange occurred with or without the inhibitors at certain side-chain methyl and methylene groups: Asn-H(β), Asp-H(β), Gln-H(γ), Glu-H(γ), and Lys-H(ε). The side-chain labeling pattern, in particular the mixed chiral labeling resulting from partial exchange at certain sites, should be of interest in studies of large proteins, protein complexes, and membrane proteins.


Figures

Figure 1
Figure 1
Expansions of the 2D 1H,13C-HSQC spectrum of SAIL chlorella ubiquitin prepared by E. coli cell-free protein synthesis. (A) 13Cβ-1Hβ region for Asp and Asn residues. The peak corresponding to the original 13Cβ–(Hβ2,Dβ3) group is indicated by a dashed red circle and labeled with an asterisk. Back exchange gave rise to two peaks corresponding to the non-degenerate CH2 protons that are circled in blue and connected by arrows. (B) Gly 13Cα-1Hα region. Four peaks were observed for each Gly residue: a major peak from the original 13Cα–(Hα2,Dα3) indicated by a dashed red circle and an asterisk, a minor peak from a species resulting from internal exchange 13Cα–(Dα2,Hα3) indicated by a red circle and an asterisk, and a doublet from 13Cα–(Hα2,Hα3) indicated by blue circles connected by arrows. (C) Alanine methyl region peaks showing signals from the original –CHD2 (dashed red circle) species and–CH2D (red circle) and –CH3 species (blue circle) resulting from exchange. The inset in each panel indicates the species that are observed for each group. The circles surrounding each group in the inset match the circles around the peaks. The species not observed for Asn/Asp, 13Cβ–(Dβ2,Hβ3), is grayed out.
Figure 1
Figure 1
Expansions of the 2D 1H,13C-HSQC spectrum of SAIL chlorella ubiquitin prepared by E. coli cell-free protein synthesis. (A) 13Cβ-1Hβ region for Asp and Asn residues. The peak corresponding to the original 13Cβ–(Hβ2,Dβ3) group is indicated by a dashed red circle and labeled with an asterisk. Back exchange gave rise to two peaks corresponding to the non-degenerate CH2 protons that are circled in blue and connected by arrows. (B) Gly 13Cα-1Hα region. Four peaks were observed for each Gly residue: a major peak from the original 13Cα–(Hα2,Dα3) indicated by a dashed red circle and an asterisk, a minor peak from a species resulting from internal exchange 13Cα–(Dα2,Hα3) indicated by a red circle and an asterisk, and a doublet from 13Cα–(Hα2,Hα3) indicated by blue circles connected by arrows. (C) Alanine methyl region peaks showing signals from the original –CHD2 (dashed red circle) species and–CH2D (red circle) and –CH3 species (blue circle) resulting from exchange. The inset in each panel indicates the species that are observed for each group. The circles surrounding each group in the inset match the circles around the peaks. The species not observed for Asn/Asp, 13Cβ–(Dβ2,Hβ3), is grayed out.
Figure 2
Figure 2
Expansions of the 2D 1H,13C-HSQC spectrum of [U-2H, 15N] chlorella ubiquitin prepared by wheat germ cell-free protein expression. (A) 13Cα-Hα region for all residues but Gly. Peaks from the residue types showing the most extensive exchange (Ala, Asp, and Gln) are circled in blue. (B) 13Cα-Hα region for Gly residues. Peaks resulting from back exchange are circled (red for one methylene proton and blue for two methylene protons); arrows connect peaks from non-degenerate CH2 protons; asterisks indicate peaks resulting from CHD or CDH groups. Dashed red circles identify signals matching the prochiral SAIL labeling pattern. Signals from residues with degenerate 1Hα chemical shifts are labeled ‘Cα-Qα’. (C) Ala methyl region showing D→H exchange mostly to –CH3 species (circled in blue). (D) 13Cβ-1Hβ region of Asp and Asn residues and 13Cε-1Hε region of Lys residues. Peaks resulting from back exchange are circled (red for one methylene proton and blue for two methylene protons); arrows connect peaks from non-degenerate CH2 protons. Dashed red circles identify signals matching the prochiral SAIL labeling pattern. Degenerate signals are labeled ‘Cε-Qε’. (E) 13Cγ-1Hγ region of Glu and Gln residues. Peaks resulting from back exchange are circled (red for one methylene proton and blue for two methylene protons); arrows connect peaks from non-degenerate CH2 protons. Dashed red circles identify signals matching the prochiral SAIL labeling pattern. Degenerate signals are labeled ‘Cγ-Qγ’.
Figure 2
Figure 2
Expansions of the 2D 1H,13C-HSQC spectrum of [U-2H, 15N] chlorella ubiquitin prepared by wheat germ cell-free protein expression. (A) 13Cα-Hα region for all residues but Gly. Peaks from the residue types showing the most extensive exchange (Ala, Asp, and Gln) are circled in blue. (B) 13Cα-Hα region for Gly residues. Peaks resulting from back exchange are circled (red for one methylene proton and blue for two methylene protons); arrows connect peaks from non-degenerate CH2 protons; asterisks indicate peaks resulting from CHD or CDH groups. Dashed red circles identify signals matching the prochiral SAIL labeling pattern. Signals from residues with degenerate 1Hα chemical shifts are labeled ‘Cα-Qα’. (C) Ala methyl region showing D→H exchange mostly to –CH3 species (circled in blue). (D) 13Cβ-1Hβ region of Asp and Asn residues and 13Cε-1Hε region of Lys residues. Peaks resulting from back exchange are circled (red for one methylene proton and blue for two methylene protons); arrows connect peaks from non-degenerate CH2 protons. Dashed red circles identify signals matching the prochiral SAIL labeling pattern. Degenerate signals are labeled ‘Cε-Qε’. (E) 13Cγ-1Hγ region of Glu and Gln residues. Peaks resulting from back exchange are circled (red for one methylene proton and blue for two methylene protons); arrows connect peaks from non-degenerate CH2 protons. Dashed red circles identify signals matching the prochiral SAIL labeling pattern. Degenerate signals are labeled ‘Cγ-Qγ’.
Figure 3
Figure 3
Expansions of the 2D 1H,13C-HSQC spectrum of [U-2H, 15N] chlorella ubiquitin prepared by wheat germ cell-free protein expression in presence the inhibitors. Labeling is as in Figure 2. (A) 13Cα-1Hα region for all residues but Gly. (B) 13Cα-1Hα region for Gly residues. (C) Ala methyl region. (D) 13Cβ-1Hβ region of Asp and Asn residues and 13Cε-1Hε region of Lys residues. (E) 13Cγ-1Hγ region of Glu and Gln residues. To allow comparison of peak intensities, all the spectra were plotted using parameters identical to those used for Figure 2.
Figure 3
Figure 3
Expansions of the 2D 1H,13C-HSQC spectrum of [U-2H, 15N] chlorella ubiquitin prepared by wheat germ cell-free protein expression in presence the inhibitors. Labeling is as in Figure 2. (A) 13Cα-1Hα region for all residues but Gly. (B) 13Cα-1Hα region for Gly residues. (C) Ala methyl region. (D) 13Cβ-1Hβ region of Asp and Asn residues and 13Cε-1Hε region of Lys residues. (E) 13Cγ-1Hγ region of Glu and Gln residues. To allow comparison of peak intensities, all the spectra were plotted using parameters identical to those used for Figure 2.
Figure 4
Figure 4
Extent (fraction) of D→H back exchange at different residue types of chlorella ubiquitin that occurred during the wheat germ cell-free translation reaction in H2O with a mixture of [U-2H, 15N]-labeled amino acids in the absence (red) and presence (blue) of the inhibitors. Values at individual residues are depicted by dots and averages by bars. (A) Exchange at backbone α-positions. (B) Exchange at side chain positions as indicated. The fraction of back-exchange is calculated such that the sum of all protonated and deuterated species adds up to 1. The contribution from deuterated species (invisible in the spectra) was estimated by comparing the volume of each peak in the 2D 1H,13C-HSQC spectrum of [U-2H, 15N]-ubiquitin with the volume of the corresponding peak in the 2D 1H,13C-HSQC spectrum of a fully protonated sample of [U-15N]-ubiquitin. The volumes of the 2D 1H,13C-HSQC peaks from the different ubiquitin samples were normalized based on 2D 1H,15N-HSQC spectra acquired for all ubiquitin samples back-to-back on the same spectrometer using the same acquisition parameters and processed identically. Table 2 contains a more detailed analysis of the distribution of the various protonated species.
Figure 4
Figure 4
Extent (fraction) of D→H back exchange at different residue types of chlorella ubiquitin that occurred during the wheat germ cell-free translation reaction in H2O with a mixture of [U-2H, 15N]-labeled amino acids in the absence (red) and presence (blue) of the inhibitors. Values at individual residues are depicted by dots and averages by bars. (A) Exchange at backbone α-positions. (B) Exchange at side chain positions as indicated. The fraction of back-exchange is calculated such that the sum of all protonated and deuterated species adds up to 1. The contribution from deuterated species (invisible in the spectra) was estimated by comparing the volume of each peak in the 2D 1H,13C-HSQC spectrum of [U-2H, 15N]-ubiquitin with the volume of the corresponding peak in the 2D 1H,13C-HSQC spectrum of a fully protonated sample of [U-15N]-ubiquitin. The volumes of the 2D 1H,13C-HSQC peaks from the different ubiquitin samples were normalized based on 2D 1H,15N-HSQC spectra acquired for all ubiquitin samples back-to-back on the same spectrometer using the same acquisition parameters and processed identically. Table 2 contains a more detailed analysis of the distribution of the various protonated species.
Scheme 1
Scheme 1
Proposed transamination reaction mechanism leading to exchange at the Hα and Hβ positions of alanine.

Similar articles

Cited by

References

    1. Bahrami A, Assadi AH, Markley JL, Eghbalnia HR. Probabilistic interaction network of evidence algorithm and its application to complete labeling of peak lists from protein NMR spectroscopy. PLoS Comput Biol. 2009;5:e1000307. - PMC - PubMed
    1. Bartels C, Xia TH, Billeter M, Güntert P, Wüthrich K. The program XEASY for computer-supported NMR spectral-analysis of biological macromolecules. J Biomol NMR. 1995;5:1–10. - PubMed
    1. Delaglio F, Grzesiek S, Vuister GW, Zhu G, Pfeifer J, Bax A. NMRPIPE - A multidimensional spectral processing system based on UNIX pipes. J Biomol NMR. 1995;6:277–293. - PubMed
    1. Etezady-Esfarjani T, Hiller S, Villalba C, Wüthrich K. Cell-free protein synthesis of perdeuterated proteins for NMR studies. J Biomol NMR. 2007;39:229–238. - PubMed
    1. Ikeya T, Takeda M, Yoshida H, Terauchi T, Jee JG, Kainosho M, Güntert P. Automated NMR structure determination of stereo-array isotope labeled ubiquitin from minimal sets of spectra using the SAIL-FLYA system. J Biomol NMR. 2009;44:261–272. - PubMed

Publication types

LinkOut - more resources