. 2011 Dec;4(6):926-35.
doi: 10.1161/CIRCEP.111.964643. Epub 2011 Oct 9.

Unique properties of the ATP-sensitive K⁺ channel in the mouse ventricular cardiac conduction system

Affiliations

Unique properties of the ATP-sensitive K⁺ channel in the mouse ventricular cardiac conduction system

Li Bao et al. Circ Arrhythm Electrophysiol. 2011 Dec.

Abstract

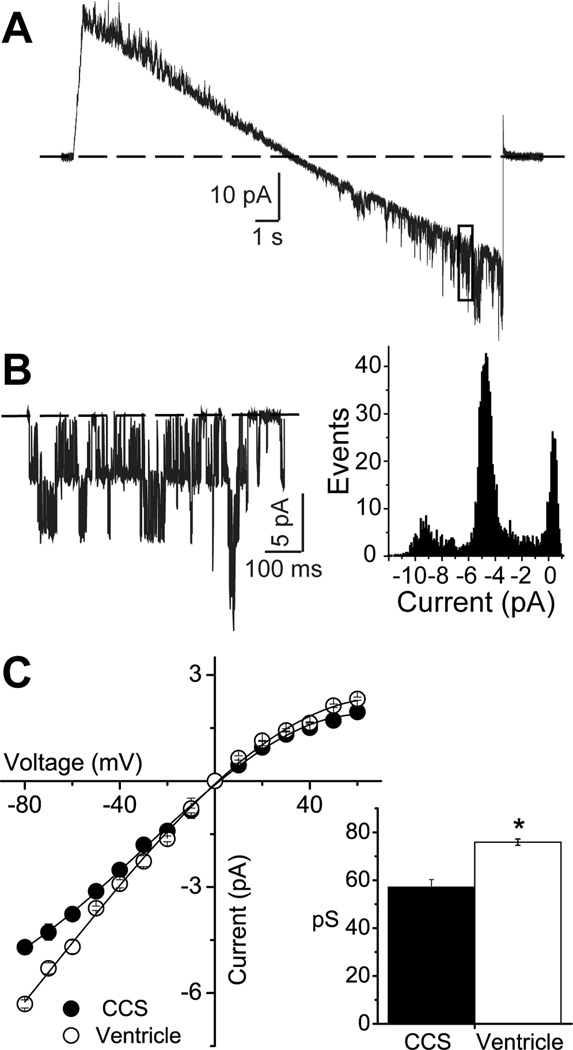
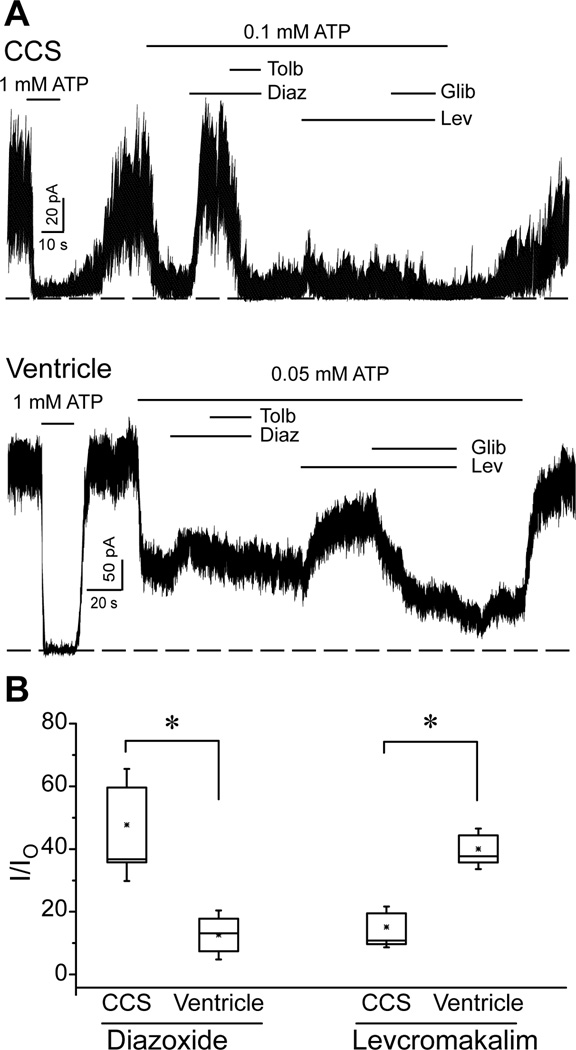
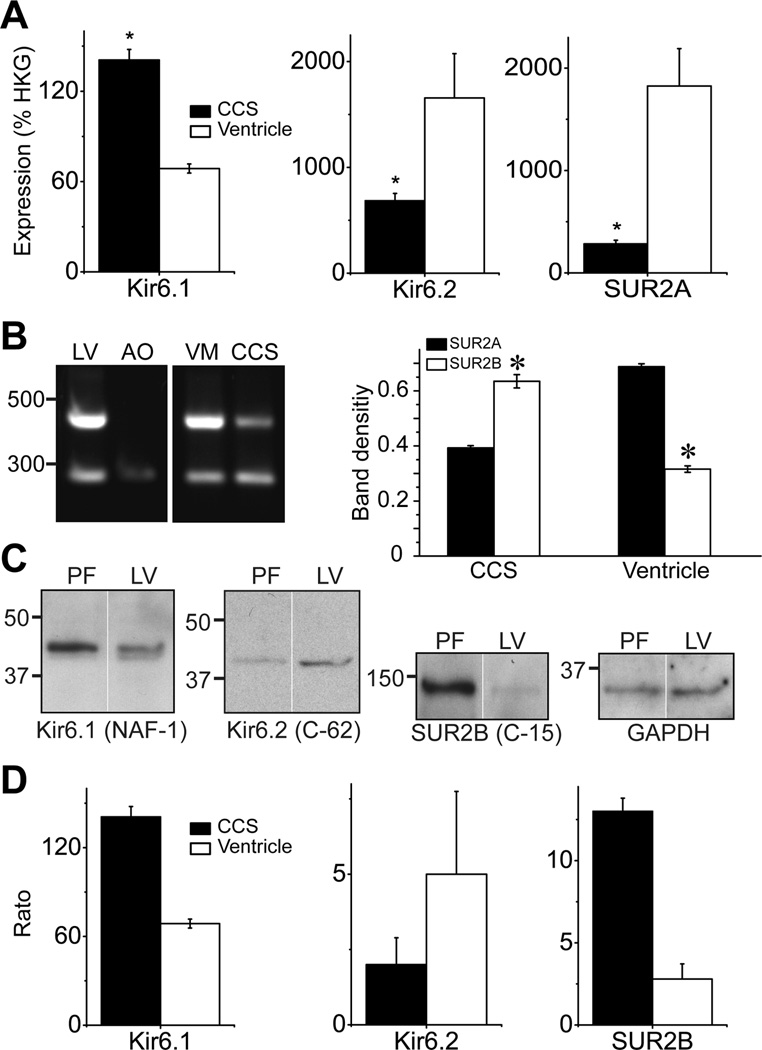
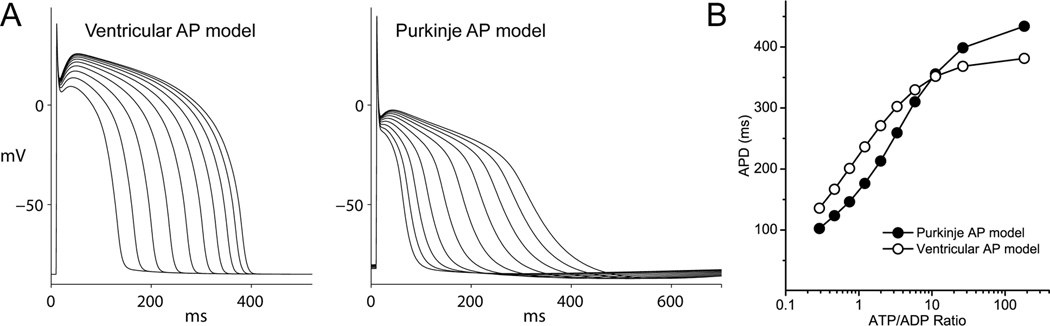
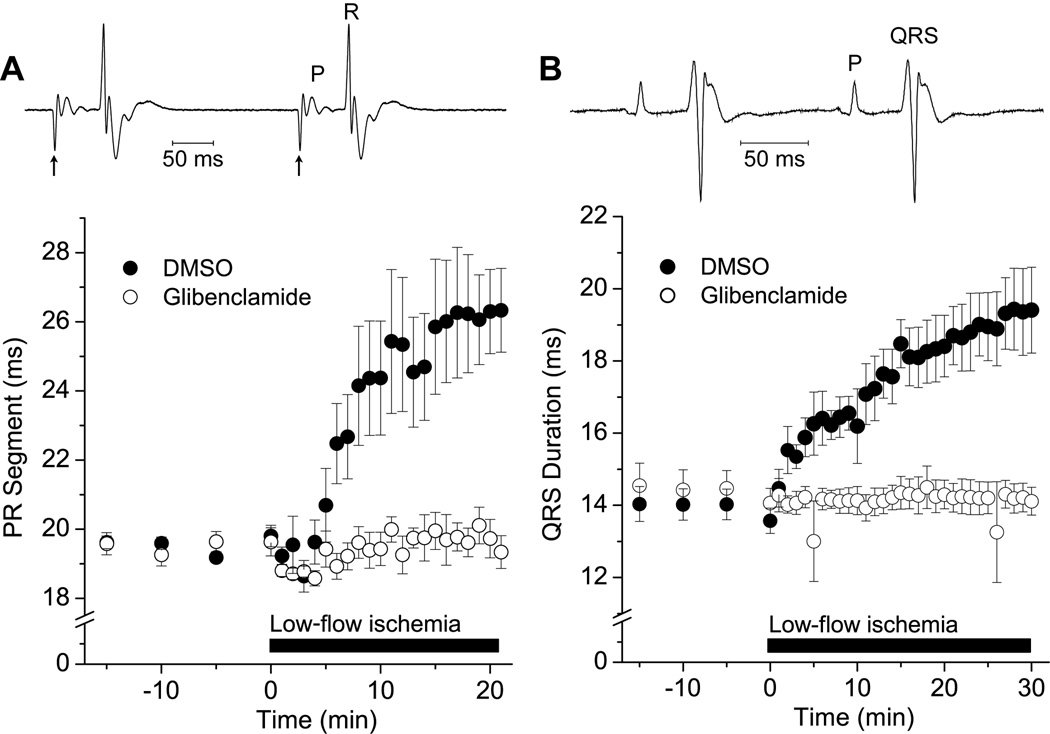
Background- The specialized cardiac conduction system (CCS) expresses a unique complement of ion channels that confer a specific electrophysiological profile. ATP-sensitive potassium (K(ATP)) channels in these myocytes have not been systemically investigated. Methods and Results- We recorded K(ATP) channels in isolated CCS myocytes using Cntn2-EGFP reporter mice. The CCS K(ATP) channels were less sensitive to inhibitory cytosolic ATP compared with ventricular channels and more strongly activated by MgADP. They also had a smaller slope conductance. The 2 types of channels had similar intraburst open and closed times, but the CCS K(ATP) channel had a prolonged interburst closed time. CCS K(ATP) channels were strongly activated by diazoxide and less by levcromakalim, whereas the ventricular K(ATP) channel had a reverse pharmacological profile. CCS myocytes express elevated levels of Kir6.1 but reduced Kir6.2 and SUR2A mRNA compared with ventricular myocytes (SUR1 expression was negligible). SUR2B mRNA expression was higher in CCS myocytes relative to SUR2A. Canine Purkinje fibers expressed higher levels of Kir6.1 and SUR2B protein relative to the ventricle. Numeric simulation predicts a high sensitivity of the Purkinje action potential to changes in ATP:ADP ratio. Cardiac conduction time was prolonged by low-flow ischemia in isolated, perfused mouse hearts, which was prevented by glibenclamide. Conclusions- These data imply a differential electrophysiological response (and possible contribution to arrhythmias) of the ventricular CCS to K(ATP) channel opening during periods of ischemia.


Conflict of interest statement

Conflict of Interest Disclosures: None

Figures

Figure 1
Figure 1
The unitary conductance of KATP channels recorded from mouse cardiomyocytes originating from the cardiac conduction system (CCS) and the ventricle. A) A representative trace of CCS KATP channel unitary events recorded during a voltage clamp ramp (111 mV/s) from −100 to 100 mV. B) Following baseline subtraction, the region of the current marked by the box (membrane potential around −80mV) is shown. Also shown is an all-points histogram for this current section. C) Current-voltage relationship of the unitary current amplitude for KATP channels recorded from CCS or ventricular myocytes. Inset: slope conductances (mean±SEM), measured between −80 and −20 mV. *p<0.05; Student’s t-test.
Figure 2
Figure 2
Dwell time kinetics of CCS and ventricular KATP channels. Shown are representative traces of KATP channel activity. Dwell time histograms were constructed (bin size of 0.2 ms) to obtain the mean open (left) and closed (right) times, obtained by exponential curve fitting. Channel activity was recorded for 30 s at −80 mV.
Figure 3
Figure 3
Nucleotide sensitivities of CCS and ventricular KATP channels. A) Representative traces of the mean patch current (patches contained many active channels). ATP (1 µmol/L to 1 mmol/L) was applied until steady state block occurred. B): Current (normalized to the maximal channel current in the absence of ATP; Io) is plotted as a function of the ATP concentration. Shown are mean±SEM of cumulative data (n=12 for CCS and ventricle). C) Representative experimental recordings demonstrating the effect of MgADP on KATP channels. D) The degree of activation was normalized as (I-I½)/(Io-I½), with I is the mean patch current, I½ the current recorded in the presence of 50 or 100 µM ATP, and Io the current measured in the absence of nucleotides (n=13 for CCS and n=12 for ventricle). The solid lines were produced by a KATP channel numerical model (see Supplemental Information). The dashed lines represent zero current.
Figure 4
Figure 4
Pharmacological profiles of CCS and ventricular KATP channels recorded in the inside-out patch clamp configuration. A) Representative recordings of a CCS or ventricular KATP channel demonstrating the effects of diazoxide (Diaz, 200 µM), diazoxide plus tolbultamide (Tolb, 200µM), levcromakalim (Lev, 30 µM) and levcromakalim plus glibenclamide (Glib, 2 µM). B) The fractional currents (relative to the maximum current in the absence of ATP; I0) in the presence of diazoxide or levcromakalim are depicted as box and whisker plots. *p<0.05; Student’s t-test.
Figure 5
Figure 5
KATP channel subunit expression in the CCS and ventricle. A) Real-time semi-quantitative RT-PCR (qRT-PCR) analysis of indicted KATP channel subunit mRNA expression in mouse CCS and ventricular myocytes. Data are expressed relative to reference genes (HKG) and represent mean±SEM of 3 experiments (*p<0.05; paired t-test). B) Conventional RT-PCR discriminates between SUR2 spice variants. A primer pair was used that resulted in a 471 bp amplicon for SUR2A and a 276 bp band for SUR2B. Shown are reactions performed with RNA isolated from mouse left ventricle (LV), aorta (AO), enzymatically isolated ventricular myocytes (VM) and CCS myocytes (CCS). The PCR products were sequenced to confirm the identity of the amplicons. The relative expression of SUR2A/SUR2B is plotted as a bar graph (mean±SEM; n=3 per group; *p<0.05). C) KATP channel subunit protein expression in canine cardiac Purkinje fibers and left ventricle. Western blotting was performed using membrane fractions and antibodies against Kir6.1 (NAF-1, 1:500), Kir6.2 (C-62, 1:200), SUR2B (C-15, 1:200) subunits and GAPDH (1:5000). D) Bar graphs represent KATP channel subunit expression levels, normalized by GAPDH expression. Data are mean±SEM (n=2–5).
Figure 6
Figure 6
Simulation of the effect of KATP channel opening on the action potential duration. A) A numerical model was developed to represent the measured activities of CCS or ventricular KATP channels. Tissue-specific KATP channel models were incorporated into an action potential model of the human ventricle or Purkinje fibers. Shown are effects on the action potential durations caused by KATP channel activation, induced by changing the ATP: ADP ratio (ATP was decreased from 6.4 to 1 mM and ADP was increased from 35 to 180 µM in 10 steps). B) Plot of the action potential duration (measured at −90% repolarization) of the data in Panel A against the ATP:ADP ratio.
Figure 7
Figure 7
Blocking KATP channels improves cardiac conduction during ischemia. A) The ECG was measured in isolated, perfused mouse hearts (top), paced at the right atrium (arrows depict stimulation artifacts). The PR segment is plotted as a function of time (bottom). The solid horizontal bar represents low-flow ischemia (25 cm H2O perfusion pressure). Shown are data with glibenclamide (2 µM, open symbols, n=5) or vehicle (DMSO, filled symbols, n=4). B) The volume-conducted ECG was also recorded from isolated rat hearts (top) and the QRS duration was measured as an index of distal Purkinje fiber function (bottom). Prior to the introduction of ischemia, hearts were perfused with glibenclamide (2 µM; n=4) or vehicle (DMSO; n=4). Ischemia was introduced by lowering the perfusion height, which caused the flow rate to decrease from 9.6±0.39 to 1.9±0.29ml/min (7.4±0.45 to 1.5±0.15 in the experimental group).

Comment in

  • "Cardiac KATP": a family of ion channels.
    Flagg TP, Nichols CG. Flagg TP, et al. Circ Arrhythm Electrophysiol. 2011 Dec;4(6):796-8. doi: 10.1161/CIRCEP.111.968081. Circ Arrhythm Electrophysiol. 2011. PMID: 22203659 Free PMC article. No abstract available.

References

    1. Noble D. The initiation of the heart beat. Oxford: Oxford University Press; 1975.
    1. Sampson KJ, Iyer V, Marks AR, Kass RS. A computational model of Purkinje fibre single cell electrophysiology: implications for the long QT syndrome. J Physiol. 2010;588:2643–2655. - PMC - PubMed
    1. Janse MJ, Kleber AG. Electrophysiological changes and ventricular arrhythmias in the early phase of regional myocardial ischemia. Circulation Research. 1981;49:1069–1081. - PubMed
    1. Noma A. ATP-regulated K+ channels in cardiac muscle. Nature. 1983;305:147–148. - PubMed
    1. Ito H, Nakajima T, Takikawa R, Hamada E, Iguchi M, Sugimoto T, Kurachi Y. Coenzyme Q10 attenuates cyanide-activation of the ATP-sensitive K+ channel current in single cardiac myocytes of the guinea-pig. Naunyn Schmiedebergs Arch Pharmacol. 1991;344:133–136. - PubMed

Publication types

MeSH terms