. 2012 Jan;125(1):69-78.
doi: 10.1093/toxsci/kfr267. Epub 2011 Oct 9.

Promotion of hepatocarcinogenesis by perfluoroalkyl acids in rainbow trout

Affiliations

Promotion of hepatocarcinogenesis by perfluoroalkyl acids in rainbow trout

Abby D Benninghoff et al. Toxicol Sci. 2012 Jan.

Abstract

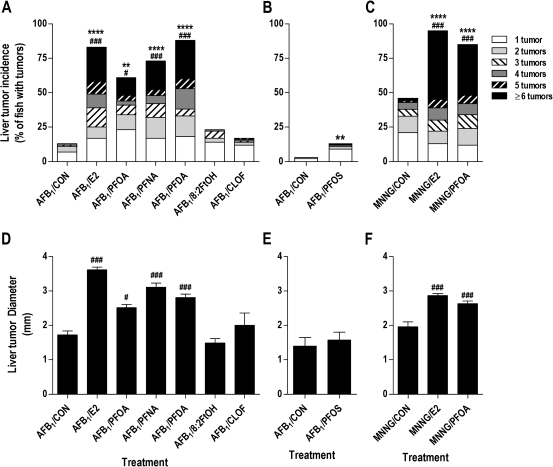
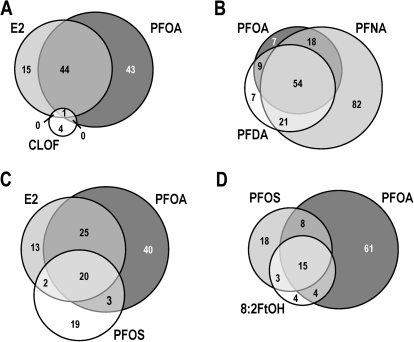
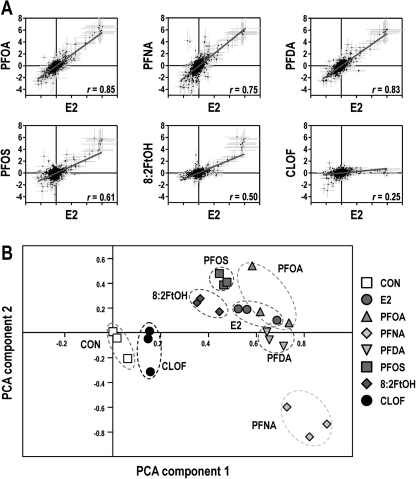
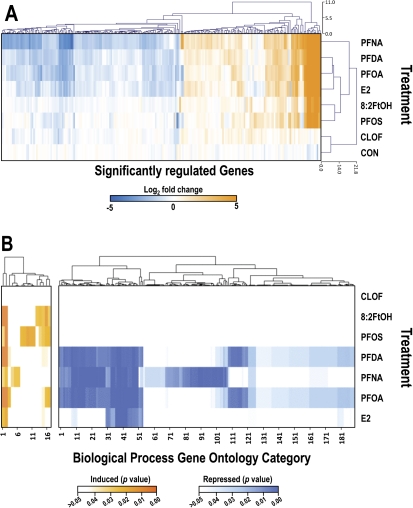
Previously, we reported that perfluorooctanoic acid (PFOA) promotes liver cancer in a manner similar to that of 17β-estradiol (E2) in rainbow trout. Also, other perfluoroalkyl acids (PFAAs) are weakly estrogenic in trout and bind the trout liver estrogen receptor. The primary objective of this study was to determine whether multiple PFAAs enhance hepatic tumorigenesis in trout, an animal model that represents human insensitivity to peroxisome proliferation. A two-stage chemical carcinogenesis model was employed in trout to evaluate PFOA, perfluorononanoic acid (PFNA), perfluorodecanoic acid (PFDA), perfluorooctane sulfonate (PFOS), and 8:2 fluorotelomer alcohol (8:2FtOH) as complete carcinogens or promoters of aflatoxin B(1) (AFB(1))- and/or N-methyl-N'-nitro-N-nitrosoguanidine (MNNG)-induced liver cancer. A custom trout DNA microarray was used to assess hepatic transcriptional response to these dietary treatments in comparison with E2 and the classic peroxisome proliferator, clofibrate (CLOF). Incidence, multiplicity, and size of liver tumors in trout fed diets containing E2, PFOA, PFNA, and PFDA were significantly higher compared with AFB(1)-initiated animals fed control diet, whereas PFOS caused a minor increase in liver tumor incidence. E2 and PFOA also enhanced MNNG-initiated hepatocarcinogenesis. Pearson correlation analyses, unsupervised hierarchical clustering, and principal components analyses showed that the hepatic gene expression profiles for E2 and PFOA, PFNA, PFDA, and PFOS were overall highly similar, though distinct patterns of gene expression were evident for each treatment, particularly for PFNA. Overall, these data suggest that multiple PFAAs can promote liver cancer and that the mechanism of promotion may be similar to that of E2.


Figures

FIG. 1.
FIG. 1.
Perfluoroalkyls increase liver tumor incidence, multiplicity and size in AFB1- and MNNG-initiated trout. (A–C) Liver tumor incidence and multiplicity (males and females). (D–F) Average liver tumor size ± SE. Trout were initiated with 10 ppm AFB1 at 10 (A, D) or 15 weeks of age (B, E) or with 35 ppm MNNG at 10 weeks (C, F). Details on experimental diets are provided in “Materials and Methods.” **p < 0.01 and ****p < 0.0001, significant difference in tumor incidence compared with CON diet (within each initiation group) as determined by logistic regression analysis (complete results in Supplementary tables 2 and 3). #p < 0.05 and ###p < 0.001, significant difference in tumor multiplicity or size compared with CON diet (within each initiation group) as determined by the Kruskal-Wallis test with Dunnett’s post hoc test for multiple comparisons. A color version of this figure is available in the online version of the article.
FIG. 2.
FIG. 2.
Venn diagrams depicting overlap of differentially regulated genes among experimental treatments. The total number of genes differentially regulated induced by the experimental treatment is indicated for each intersection. A color version of this figure is available in the online version of the article.
FIG. 3.
FIG. 3.
Dietary exposure to PFAAs induces an estrogen-like hepatic gene expression profile in trout. (A) Pairwise correlation of hepatic gene expression profiles. Values shown are the log2 geometric mean of fold change for each array feature ± SE (n = 3). Pearson correlation coefficients (r) are indicated for each comparison, and overlay lines indicate results of least-squares linear regression analysis. A color version of this figure is available in the online version of this article. (B) PCA on experimental condition. PC1 and PC2 are shown and account for 57.9 and 9.6% of experiment variance, respectively. Symbols represent biological replicates (n = 3), and dashed circles represent overlap, or lack thereof, among treatment groups. A color version of this figure is available in the online version of the article.
FIG. 4.
FIG. 4.
Bi-directional hierarchical clustering of gene expression data and CIM showing impact of treatment diet on enrichment of biological process GO terms. (A) Unsupervised bi-directional hierarchical cluster analysis. The heat map shows expression data (geometric mean of log2 values, n = 3) for genes differentially regulated twofold up or down (p < 0.05 by Welch’s t-test) in at least one treatment group clustered by array feature (top tree) and treatment (left tree). (B) Gene ontology enrichment analysis was performed using GoMiner, and unsupervised cluster analyses of GO categories were performed using CIMminer as described above. Scale bars represent the range of FDR-corrected p values: orange for biological process categories induced by experimental diets, blue for those repressed and white for unchanged. The indicated numbers for GO term categories correspond to rows in Supplementary tables 7 and 8. A significant effect of dietary treatment on enrichment of the GO term category (biological process) was inferred p < 0.05 as determined by a one-sided Fisher’s exact test after FDR correction.

References

    1. Abdellatif A, Préat V, Taper H, Roberfroid M. The modulation of rat liver carcinogenesis by perfluorooctanoic acid, a peroxisome proliferator. Toxicol. Appl. Pharmacol. 1991;111:530–537. - PubMed
    1. Bailey GS, Williams DE, Hendricks JD. Fish models for environmental carcinogenesis: The rainbow trout. Environ. Health Perspect. 1996;104(Suppl. 1):5–21. - PMC - PubMed
    1. Benninghoff AD, Bisson WH, Koch DC, Ehresman DJ, Kolluri SK, Williams DE. Estrogen-like activity of perfluoroalkyl acids in vivo and interaction with human and rainbow trout estrogen receptors. in vitro. Toxicol. Sci. 2011;120:42–58. - PMC - PubMed
    1. Benninghoff AD, Williams DE. Identification of a transcriptional fingerprint of estrogen exposure in rainbow trout liver. Toxicol. Sci. 2008;101:65–80. - PMC - PubMed
    1. Brandsma SH, Smithwick M, Solomon K, Small J, de Boer J, Muir DC. Dietary exposure of rainbow trout to 8:2 and 10:2 fluorotelomer alcohols and perfluorooctanesulfonamide: Uptake transformation and elimination. Chemosphere. 2011;82:253–258. - PubMed

Publication types

MeSH terms