. 2011 Dec;60(12):3279-88.
doi: 10.2337/db11-0758. Epub 2011 Oct 7.

PTPN2, a candidate gene for type 1 diabetes, modulates pancreatic β-cell apoptosis via regulation of the BH3-only protein Bim

Affiliations

PTPN2, a candidate gene for type 1 diabetes, modulates pancreatic β-cell apoptosis via regulation of the BH3-only protein Bim

Izortze Santin et al. Diabetes. 2011 Dec.

Abstract

Objective: Genome-wide association studies allowed the identification of several associations between specific loci and type 1 diabetes (T1D). However, the mechanisms by which most candidate genes predispose to T1D remain unclear. We presently evaluated the mechanisms by which PTPN2, a candidate gene for T1D, modulates β-cell apoptosis after exposure to type I and II interferons (IFNs), cytokines that contribute to β-cell loss in early T1D.

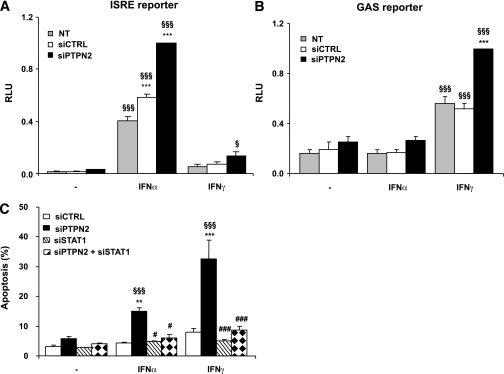
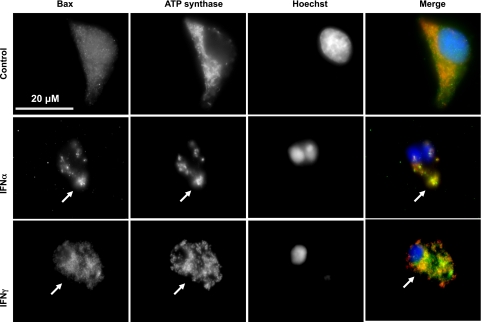
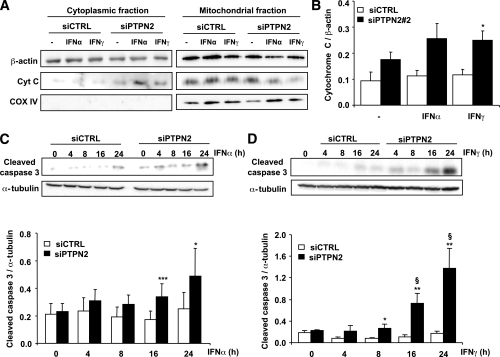
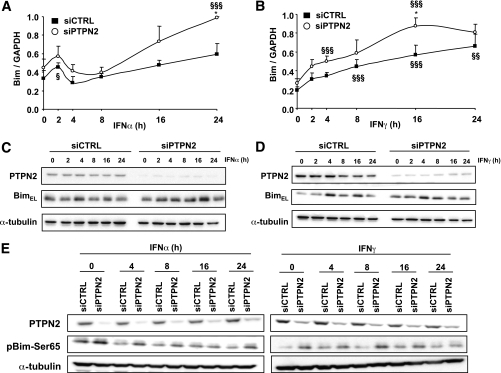
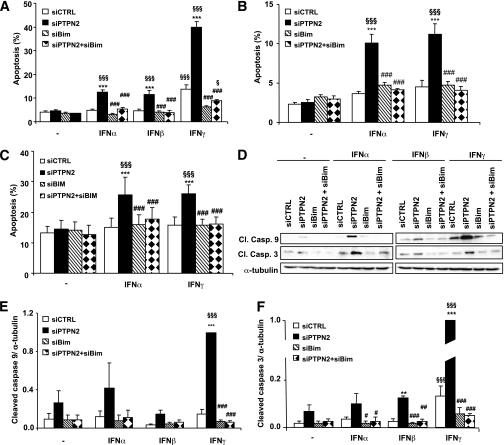
Research design and methods: Small interfering RNAs were used to inhibit PTPN2, STAT1, Bim, and Jun NH(2)-terminal kinase 1 (JNK1) expression. Cell death was assessed by Hoechst and propidium iodide staining. BAX translocation, Bim phosphorylation, cytochrome c release, and caspases 9 and 3 activation were measured by Western blot or immunofluorescence.

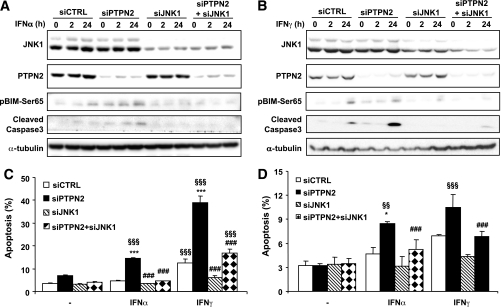
Results: PTPN2 knockdown exacerbated type I IFN-induced apoptosis in INS-1E, primary rat, and human β-cells. PTPN2 silencing and exposure to type I and II IFNs induced BAX translocation to the mitochondria, cytochrome c release, and caspase 3 activation. There was also an increase in Bim phosphorylation that was at least in part regulated by JNK1. Of note, both Bim and JNK1 knockdown protected β-cells against IFN-induced apoptosis in PTPN2-silenced cells.

Conclusions: The present findings suggest that local IFN production may interact with a genetic factor (PTPN2) to induce aberrant proapoptotic activity of the BH3-only protein Bim, resulting in increased β-cell apoptosis via JNK activation and the intrinsic apoptotic pathway. This is the first indication of a direct interaction between a candidate gene for T1D and the activation of a specific downstream proapoptotic pathway in β-cells.


Figures

FIG. 1.
FIG. 1.
PTPN2 inhibition exacerbates type I and II IFN–induced apoptosis in INS-1E cells and primary rat β-cells. A: INS-1E cells were left untransfected (NT) (gray bars) or transfected with siCTRL (white bars) or siPTPN2 (black bars). After 48 h of recovery, cells were left untreated (-) or treated for 24 h with IFNα (1,000 units/mL), IFNβ (1,000 units/mL), or IFNγ (100 units/mL) as indicated. Apoptosis was evaluated using Hoechst and propidium iodide staining. Results are means ± SEM of four independent experiments; §§§P < 0.001 vs. untreated (i.e., not treated with cytokines) siPTPN2; ***P < 0.001 vs. NT or siCTRL treated with the same cytokine; ANOVA. B: Primary rat β-cells were treated as in A, but cells were exposed to cytokines for 48 h and two independent siRNAs against PTPN2 were used. Results are means ± SEM of three to five independent experiments; §§§P < 0.001 vs. untreated (i.e., not treated with cytokines) siCTRL or siPTPN2; **P < 0.01 and ***P < 0.001 vs. siCTRL treated with the same cytokine; ANOVA. C: INS-1E cells were left NT or transfected with siCTRL, siPTPN2, siRNA against IFNα/β receptor α chain, or a combination of siPTPN2 and siRNA against IFNα/β receptor α chain. After 48 h of recovery, cells were left NT (-) or transfected with PIC as described in research design and methods. Results are means ± SEM of five independent experiments; §§§P < 0.001 vs. NT + PIC, *P < 0.05 and ***P < 0.001 vs. untreated (i.e., not transfected with PIC) transfected with the same siRNA; ###P < 0.001 vs. siPTPN2 + PIC; ANOVA.
FIG. 2.
FIG. 2.
Inhibition of PTPN2 increases ISRE and GAS reporter activity after IFNα or IFNγ treatment and favors apoptosis via STAT1 activation. Twelve hours after transfection with siCTRL or siPTPN2, cells were cotransfected with an ISRE (A) or GAS reporter construct (B) plus a pRL-CMV plasmid (used as internal control); cells were then treated with IFNα or IFNγ for 4 h, and luciferase activity was measured. Results are mean ± SEM of four to seven independent experiments shown as relative light units; §P < 0.05 and §§§P < 0.001 vs. untreated (i.e., not treated with cytokines) transfected with the same siRNA; ***P < 0.001 vs. untransfected (NT) or siCTRL treated with the same cytokine; ANOVA. C: INS-1E cells were transfected with siCTRL, siPTPN2, siSTAT1, or the combination of siPTPN2 and siSTAT1. After 48 h of recovery, cells were left untreated or treated for 24 h with IFNα (1,000 units/mL) or IFNγ (100 units/mL) as indicated. Apoptosis was evaluated using Hoechst and propidium iodide staining. Results are means ± SEM of three to five independent experiments; §§§P < 0.001 vs. untreated (i.e., not treated with cytokines) siPTPN2; **P < 0.01 and ***P < 0.001 vs. siCTRL treated with the same cytokine; #P < 0.05 and ###P < 0.001 vs. siPTPN2 treated with the same cytokine; ANOVA. RLU, relative light units.
FIG. 3.
FIG. 3.
PTPN2 inhibition increases IFN-induced β-cell death via BAX activation. Cells were transfected with an siPTPN2, and after 48 h of recovery they were left untreated (control) or treated for 16 h with IFNα or IFNγ. For immunofluorescence analysis, they were incubated with antibodies specific for BAX, used as a mitochondrial marker ATP synthase, and stained with HO for nuclear morphology evaluation. Arrows indicate mitochondrial localization of BAX. The figure is representative of three independent experiments. (A high-quality digital representation of this figure is available in the online issue.)
FIG. 4.
FIG. 4.
Inhibition of PTPN2 in INS-1E cells induces cytochrome c release to the cytoplasm and activation of the effector caspase 3 after IFN stimulation. A: Cells were transfected with siCTRL or siPTPN2, and after 48 h of recovery they were exposed to IFNα or IFNγ. Cytochrome c release from the mitochondria to the cytoplasm was analyzed by Western blot. β-Actin was used as loading control, and cyclooxygenase IV was used as mitochondrial marker. B: Mean optical densitometry measurement of cytochrome c in the cytoplasmic fraction. Results are mean ± SEM of five independent experiments; *P < 0.05 vs. siCTRL treated with the same cytokine; ANOVA. C and D: Cells transfected with siCTRL or siPTPN2 were exposed to IFNα (C) or IFNγ (D) for 4, 8, 16, or 24 h, and expression of cleaved caspase 3 protein was measured by Western blot. Cleaved caspase 3 values are corrected for protein loading by α-tubulin determination, and densitometry results are represented as the mean ± SEM of three to six independent experiments; §P < 0.05 vs. untreated (i.e., not treated with cytokines) transfected with the siRNA; *P < 0.05, **P < 0.01, and ***P < 0.001 vs. siCTRL treated at the same time point with IFNα or IFNγ; ANOVA.
FIG. 5.
FIG. 5.
Silencing of PTPN2 in INS-1E cells upregulates Bim mRNA (A and B) but not Bim protein expression (C and D) after IFNα or IFNγ treatment. PTPN2 inhibition in INS-1E cells induces Bim phosphorylation at Ser65 (E). Cells were transfected with siCTRL or siPTPN2, and after 48 h of recovery, they were left untreated or treated with IFNα (A) or IFNγ (B) for 2, 4, 8, 16, or 24 h. Bim mRNA expression was assayed by RT-PCR and normalized by the housekeeping gene glyceraldehyde-3-phosphate dehydrogenase (GAPDH). Results are means ± SEM of five independent experiments; §P < 0.05, §§P < 0.01, and §§§P < 0.001 vs. untreated (i.e., not treated with cytokines) transfected with the same siRNA; *P < 0.05 vs. siCTRL treated at the same time point with IFNα or IFNγ; ANOVA. C and D: Cells were transfected with siCTRL or siPTPN2 and after 48 h of recovery were left untreated or treated with IFNα (C) or IFNγ (D) for 2, 4, 8, 16, or 24 h. Cells were lysed with Laemmli buffer, and expression of PTPN2 (for knockdown confirmation), BimEL, and α-tubulin (as protein loading control) was analyzed by Western blot. Results are representative of five independent experiments. E: Cells were transfected with siCTRL or siPTPN2; after 48 h of recovery, they were left untreated or exposed to IFNα or IFNγ for 4, 8, 16, or 24 h. Expression of PTPN2 (for knockdown confirmation), phosphorylated Bim (pBim)-Ser65, and α-tubulin (used as loading control) was analyzed by Western blot. Results are representative of five to eight experiments.
FIG. 6.
FIG. 6.
Double knockdown of PTPN2 and Bim protects INS-1E cells, primary rat β-cells, and human islets cells from type I and II IFN–induced apoptosis. INS-1E cells, primary rat β-cells, and human islet cells were transfected with an siCTRL, siPTPN2, or siRNA targeting Bim, or double transfected with both siPTPN2 and siRNA targeting Bim. After 48 h of recovery, they were left untreated (-) or treated with IFNα, IFNβ, or IFNγ as indicated. Apoptosis was evaluated in INS-1E cells (A), rat primary β-cells (B), and dispersed human islet cells (C) by Hoechst and propidium iodide staining. Results are the mean ± SEM of three to four independent experiments; §§§P < 0.001 and §P < 0.05 vs. untreated (i.e., not treated with cytokines) transfected with the same siRNA; ***P < 0.001 vs. siCTRL treated with the same cytokine; ###P < 0.001 vs. siPTPN2 treated with the same cytokine; ANOVA. D: Expression of cleaved caspase 9, cleaved caspase 3, and α-tubulin was evaluated by Western blot in INS-1E cells. Mean optical densitometry measurements of cleaved caspases 9 (E) and 3 (F) (Western blots corrected by protein loading by α-tubulin). Results are means ± SEM of three independent experiments; §§§P < 0.001 vs. untreated (i.e., not treated with cytokines) transfected with the same siRNA; ***P < 0.001 and **P < 0.01 vs. siCTRL treated with the same cytokine; ###P < 0.001, ##P < 0.01, and #P < 0.05 vs. siPTPN2 treated with the same cytokine; ANOVA.
FIG. 7.
FIG. 7.
Double knockdown of PTPN2 and JNK1 reduces phosphorylated Bim (pBim)-Ser65 phosphorylation and protects INS-1E cells and primary rat β-cells from type I and II IFN–induced apoptosis. INS-1E cells and primary rat β-cells were transfected with an siCTRL, siPTPN2, or siRNA targeting JNK1, or double transfected with both siPTPN2 and siRNA targeting JNK1. After 48 h of recovery, they were left untreated or treated with IFNα or IFNγ as indicated. Expression of pBim-Ser65, cleaved caspase 3, JNK1, PTPN2, and α-tubulin was evaluated by Western blot in INS-1E cells after IFNα (A) or IFNγ (B) treatment. Results are representative of five independent experiments. Apoptosis was evaluated in INS-1E cells (C) and primary rat β-cells (D) by Hoechst and propidium iodide staining. Results are the mean ± SEM of three to four independent experiments; §§§P < 0.001 and §§P < 0.01 vs. untreated (i.e., not treated with cytokines) transfected with the same siRNA; ***P < 0.001 and *P < 0.05 vs. siCTRL treated with the same cytokine; ###P < 0.001 vs. siPTPN2 treated with the same cytokine; ANOVA.

References

    1. Todd JA, Walker NM, Cooper JD, et al. ; Genetics of Type 1 Diabetes in Finland; Wellcome Trust Case Control Consortium Robust associations of four new chromosome regions from genome-wide analyses of type 1 diabetes. Nat Genet 2007;39:857–864 - PMC - PubMed
    1. Concannon P, Rich SS, Nepom GT. Genetics of type 1A diabetes. N Engl J Med 2009;360:1646–1654 - PubMed
    1. Peng H, Hagopian W. Environmental factors in the development of type 1 diabetes. Rev Endocr Metab Disord 2006;7:149–162 - PubMed
    1. Hardy J, Singleton A. Genomewide association studies and human disease. N Engl J Med 2009;360:1759–1768 - PMC - PubMed
    1. Cadwell K, Patel KK, Maloney NS, et al. Virus-plus-susceptibility gene interaction determines Crohn’s disease gene Atg16L1 phenotypes in intestine. Cell 2010;141:1135–1145 - PMC - PubMed

Publication types

MeSH terms