. 2011;6(9):e25424.
doi: 10.1371/journal.pone.0025424. Epub 2011 Sep 30.

Activation of anti-tumor immune response and reduction of regulatory T cells with Mycobacterium indicus pranii (MIP) therapy in tumor bearing mice

Affiliations

Activation of anti-tumor immune response and reduction of regulatory T cells with Mycobacterium indicus pranii (MIP) therapy in tumor bearing mice

Faiz Ahmad et al. PLoS One. 2011.

Abstract

Background: Role of immune system in protecting the host from cancer is well established. Growing cancer however subverts immune response towards Th2 type and escape from antitumor mechanism of the host. Activation of both innate and Th1 type response is crucial for host antitumor activity. In our previous study it was found, that Mycobacterium indicus pranii (MIP) also known as M. w induces Th1 type response and activates macrophages in animal model of tuberculosis. Hence, we studied the immunotherapeutic potential of MIP in mouse tumor model and the underlying mechanisms for its antitumor activity.

Methodology and principal findings: Tumors were implanted by injecting B16F10 melanoma cells subcutaneously into C57BL/6 mice. Using the optimized dose and treatment regimes, anti-tumor efficacy of heat killed MIP was evaluated. In MIP treated group, tumor appeared in only 50-60% of mice, tumor growth was delayed and tumor volume was less as compared to control. MIP mediated immune activation was analysed in the tumor microenvironment, tumor draining lymph node and spleen. Induction of Th1 response and higher infiltration of immune cells in the tumor microenvironment was observed in MIP treated mice. A large fraction of these immune cells were in activated state as confirmed by phenotypic and functional analysis. Interestingly, percentage of Treg cells in the tumor milieu of treated mice was less. We also evaluated efficacy of MIP along with chemotherapy and found a better response as compared to chemotherapy alone.

Conclusion: MIP therapy is effective in protecting mice from tumor. It activates the immune cells, increases their infiltration in tumor, and abrogates tumor mediated immune suppression.


Conflict of interest statement

Competing Interests: The authors have declared that no competing interests exist.

Figures

Figure 1
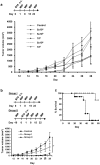
Figure 1. Standardisation of dose and treatment regimen of MIP.
a) 30,000 B16F10 melanoma cells were injected in the right flank of C57BL/6 mice on day 0. MIP dose in the range of 5.0×10⁴ to 1.0×10⁸ bacilli per 100 µl of PBS was given peritumorally at 7 day interval starting from day one. Tumor growth was measured every 2 days. Control tumor bearing mice were injected saline. Dose of 5.0×10⁶ bacilli gave optimum protection. Data are mean ± SE values obtained from 8 mice/group. b) MIP at a dose of 5.0×10⁶ bacilli per 100 µl PBS was further evaluated using two different treatment regimens viz. therapeutic (Group I) and prophylactic+therapeutic (Group II). Treatment schedule is shown in the figure. In comparison to therapeutic regimen, prophylactic+therapeutic regimen was found to be more effective. This treatment regimen was therefore used for all the subsequent studies. c) For survival studies less number (10,000) of B16F10 melanoma cells were injected subcutaneously in the right flank and MIP treatment (as for Group II) was followed. Percent survival for observation period of 60 days is shown for control and MIP treated mice. (•) Control group; (○) MIP treated group. Tumor volume = 0.5×large diameter×small diameter2. *p<0.05.
Figure 2
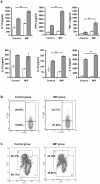
Figure 2. Evaluation of MIP induced modulation of immune response.
Splenocytes from control and MIP treated tumor bearing mice were prepared after 3 weeks of tumor implantation and restimulated in vitro with MIP antigen for 48 hrs. a) Culture supernatants was analyzed for IL-12, IFN-γ, IL-2, IL-15, TNF-α and IL-10 by ELISA. Each bar represents the mean ± SD of the two independent experiments (n = 4). (□) unstimulated; (▪) restimulated with MIP antigen; *p<0.05; **p<0.01; ***p<0.0001. b) Activation of splenocytes after in vitro restimulation with MIP antigen. Splenocytes were isolated, restimulated in vitro with MIP antigen for 48 hrs and were stained with respective Abs using standard staining method. Cells were analyzed by flow cytometry. In comparison to control group, percentage of cells expressing CD69 and CD86 was higher in the MIP treated group; (formula image) unlabelled cells; (––) labelled cells.
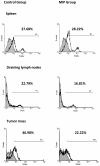
Figure 3
Figure 3. Phenotypic analysis of immune cells in tumor draining lymph node (TDLN) and Tumor.
a) Inguinal lymph nodes were removed from tumor bearing mice two weeks after tumor cell implantation. Single cell suspension were then analysed for expression of CD3, CD8, NK1.1, CD80, CD86, and MHCII by flow cytometry. Each bar represents the mean ± SD of the two independent experiments (n = 3). b) Single cell suspension obtained from buffy layer of ficoll gradient, of tumor cell suspension was analyzed for immune cell infiltration. Higher infiltration of immune cells was observed in the MIP treated mice. c) Immune cell subtypes infiltrating the tumor. Number of specific cells (N) per gram of tumor was calculated by formula: N = NSxNT/NAxW, where NS is the number of specific immune cells in the total acquired cells on flow cytometer; NA is the total no. of acquired cells; NT is the total number of cells in the buffy coat on ficoll gradient; W is the tumor weight in gram. Tumors in MIP treated mice were found to be infiltrated with higher number of lymphocytes, activated macrophages and dendritic cells; experiment was repeated twice; each group having 6 animals. Data shown is mean of two independent experiments (mean ± SD). *p<0.05; **p<0.01; p = 0.05.
Figure 4
Figure 4. Treg cells in spleen, tumor draining lymph node and tumor mass.
Single cell suspension from spleen, tumor draining lymph nodes, and tumor of control and MIP treated tumor bearing mice were analyzed for the expression of CD4 and FoxP3 by flow cytometry. In tumor microenvironment and tumor draining lymph node, the percentage of Treg cells were found to be lower in the MIP treated group as compared to control. In spleen comparable level of these cells were found in both, treated and untreated groups. (formula image) CD4+ cells; (––) CD4+FoxP3+ cells.
Figure 5
Figure 5. Tumor cell specific immune response.
a) Splenocytes from control and MIP treated tumor bearing mice at 3 weeks after tumor implantation were in-vitro restimulated with UV-irradiated B16F10 melanoma cells for 48 hrs. Culture supernatants were then analyzed for the levels of IL-12, IFN-γ, TNF-α, IL-10, IL-1β and IL-6 by ELISA. Each bar represents the mean ± SD of the two independent experiments (n = 4); (□) unstimulated; (▪) restimulated; **p<0.01. b) NK cell cytotoxicity. To check NK cell cytotoxicity, CFSE labeled Yac-1 target cells were co-cultured with splenocytes from control and MIP treated tumor bearing mice for 6 hrs. Target cell killing was analysed on the basis of PI uptake by flow cytometry. Cytotoxicity was found to be higher in the MIP treated group as compared to control. c) CTL response against B16 melanoma cells. CTLs were derived from splenocytes of control and MIP treated tumor bearing mice by culturing with UV-irradiated B16F10 cells and rIL-2 for 5 days. Cytotoxicity was determined by co-culturing CTLs with CFSE-labeled B16F10 target cells. % Cytotoxicity = 100×[No. of CFSE & PI double positive cells]÷[(No. of CFSE positive cells)+(No. of CFSE & PI double positive cells)].
Figure 6
Figure 6. Antitumor activity of MIP given with Cyclophosphamide.
Mice were treated with CTX alone or CTX along with MIP (CTX+MIP). CTX was given intraperitoneally on day 7th after tumor cell implantation at a dose of 200 mg/kg in both groups. In CTX+MIP group, MIP injection was given at 1 week interval as shown in figure. Each line in graph represents tumor growth curve of individual mice. MIP given along with CTX therapy showed higher protection as compared to CTX alone. 4 out of 8 mice were free of tumor and tumor volume was also less in this group. * symbolize the death of mice on the corresponding day. Number in parenthesis indicates number of mice showing tumor out of 8 mice.

References

    1. Jarnicki AG, Lysaght J, Todryk S, Mills KH. Suppression of antitumor immunity by IL-10 and TGF-beta-producing T cells infiltrating the growing tumor: influence of tumor environment on the induction of CD4+ and CD8+ regulatory T cells. J Immunol. 2006;177:896–904. - PubMed
    1. Park SH, Kyin T, Bendelac A, Carnaud C. The contribution of NKT cells, NK cells, and other gamma-chain-dependent non-T non-B cells to IL-12-mediated rejection of tumors. J Immunol. 2003;170:1197–1201. - PubMed
    1. Baxevanis CN, Gritzapis AD, Papamichail M. In vivo antitumor activity of NKT cells activated by the combination of IL-12 and IL-18. J Immunol. 2003;171:2953–2959. - PubMed
    1. Alexandroff AB, Jackson AM, O'Donnell MA, James K. BCG immunotherapy of bladder cancer: 20 years on. Lancet. 1999;353:1689–1694. - PubMed
    1. Hayashi A, Doi O, Azuma I, Toyoshima K. Immuno-friendly use of BCG-cell wall skeleton remarkably improves the survival rate of various cancer patients. Proc Japn Acad. 1998;74:50–55.

Publication types

Substances