. 2011;6(9):e25593.
doi: 10.1371/journal.pone.0025593. Epub 2011 Sep 30.

The dpsA gene of Streptomyces coelicolor: induction of expression from a single promoter in response to environmental stress or during development

Affiliations

The dpsA gene of Streptomyces coelicolor: induction of expression from a single promoter in response to environmental stress or during development

Paul D Facey et al. PLoS One. 2011.

Erratum in

  • PLoS One. 2011;6(11). doi:10.1371/annotation/8fedd9bb-d84e-4d7b-bc71-3321e652198d

Abstract

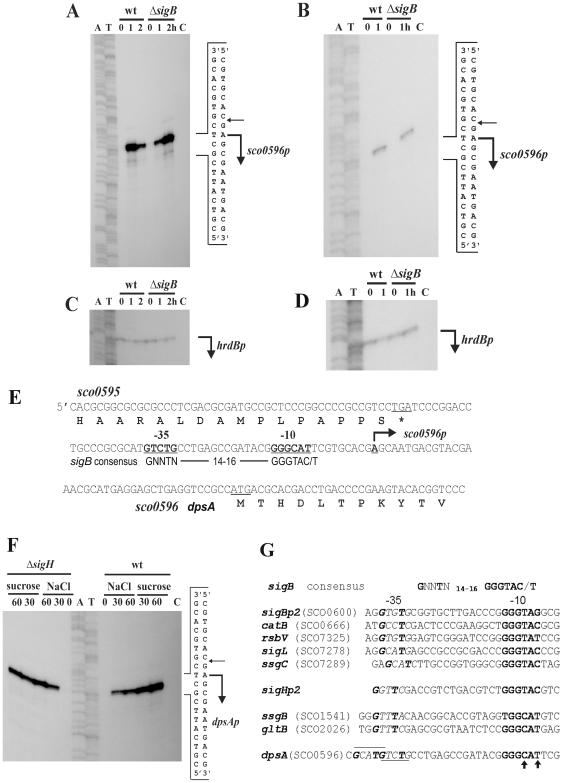
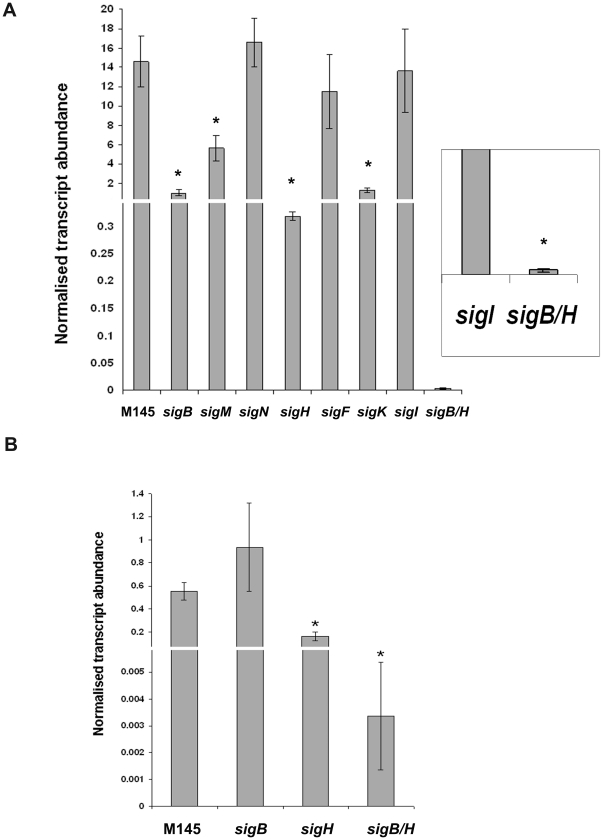
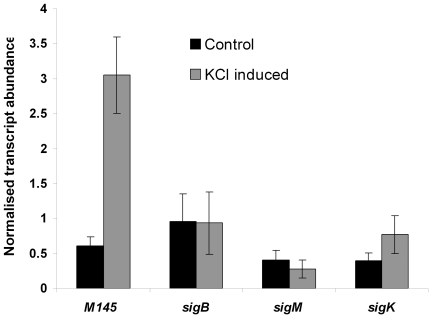
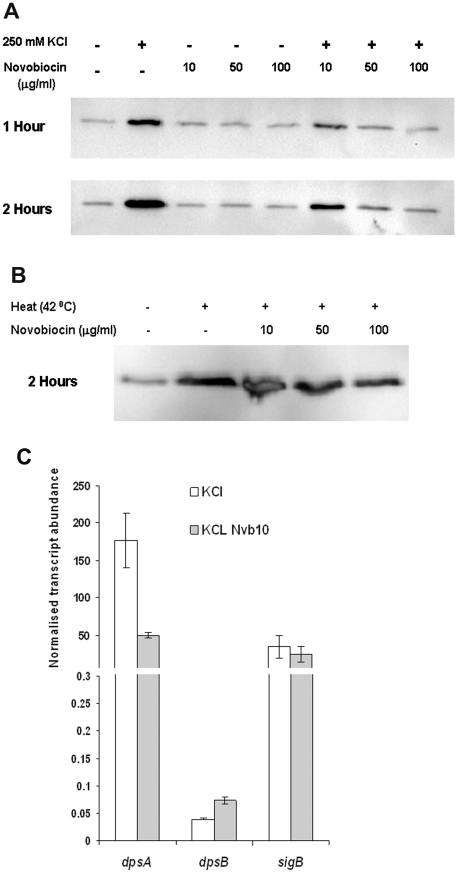
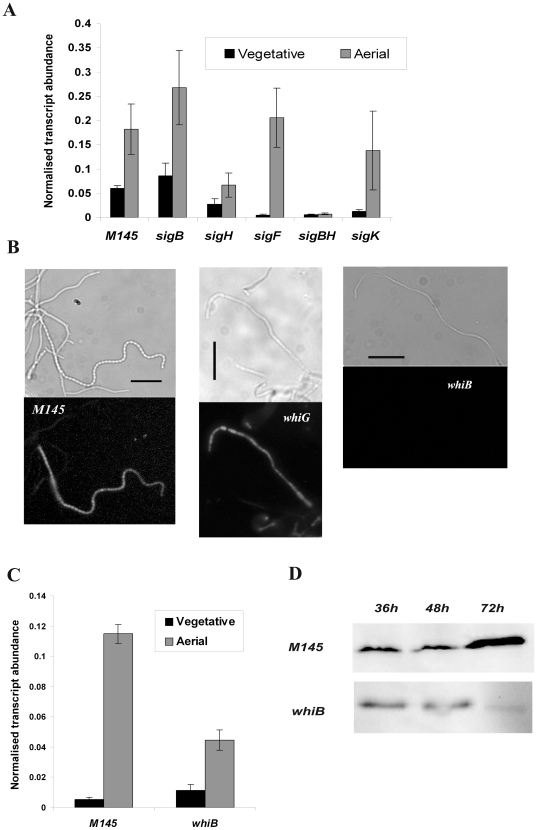
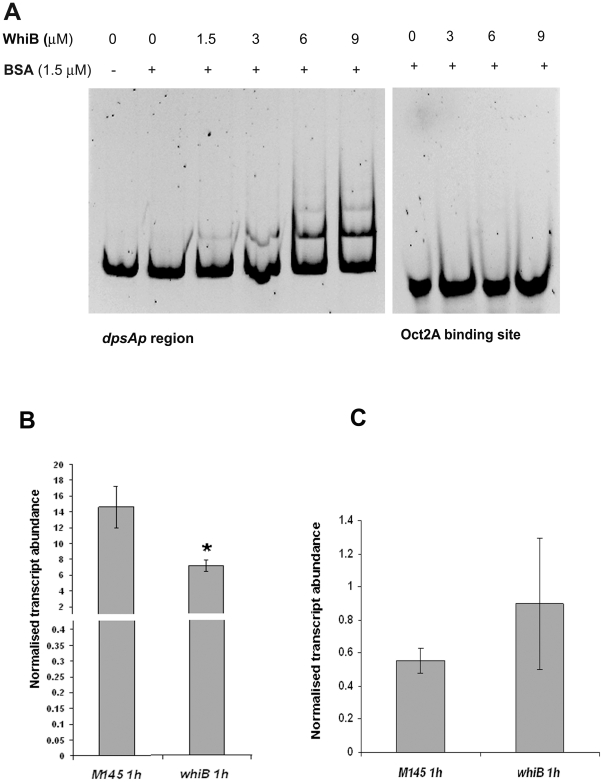
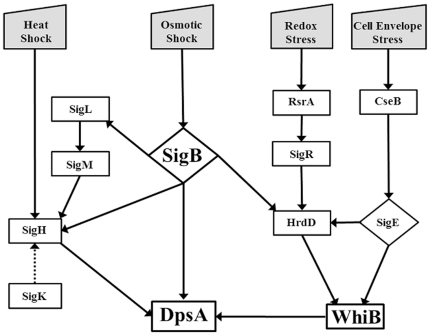
The DpsA protein plays a dual role in Streptomyces coelicolor, both as part of the stress response and contributing to nucleoid condensation during sporulation. Promoter mapping experiments indicated that dpsA is transcribed from a single, sigB-like dependent promoter. Expression studies implicate SigH and SigB as the sigma factors responsible for dpsA expression while the contribution of other SigB-like factors is indirect by means of controlling sigH expression. The promoter is massively induced in response to osmotic stress, in part due to its sensitivity to changes in DNA supercoiling. In addition, we determined that WhiB is required for dpsA expression, particularly during development. Gel retardation experiments revealed direct interaction between apoWhiB and the dpsA promoter region, providing the first evidence for a direct WhiB target in S. coelicolor.


Conflict of interest statement

Competing Interests: The authors have declared that no competing interests exist.

Figures

Figure 1
Figure 1. High-resolution S1-nuclease mapping the transcription start point (TSP) of S. coelicolor dpsA (SCO0596).
Bent arrows indicate the positions of RNA-protected fragments. A: Total RNA from S. coelicolor M145 and its isogenic sigB mutant grown for 17 h on a cellophane disc on top of MS agar (lane 0), then transferred to MS containing 250 mM KCl for 1 h (lane 1) and 2 hours (lane 2). B: Total RNA from cells grown as above but transferred for 1 h to 42°C (lane 1). C and D: Control S1-nuclease mapping experiments with the same RNA samples using a DNA probe for the hrdBp promoter. E: Nucleotide sequence of S. coelicolor M145 SCO0596 promoter region. The deduced protein product is shown below. The TSP of the SCO0596 promoter is indicated by the bent arrow. The proposed −10 and −35 boxes of the promoter are in bold characters and underlined. F: S1-nuclease protection assay using RNA isolated from S. coelicolor M145 and sigH mutant (as indicated above the figure), grown for 20 h in liquid minimal NMP+0.5% mannitol medium (lane 0) and osmotic stress induced by addition of NaCl (final concentration 0.5 M) or sucrose (final concentration 1 M) and incubated for 30 min (lane 30) and 60 min (lane 60). In all cases lane C is E. coli tRNA, used as negative control G: Promoter sequences of consensus sigB-like, sigBp2, sigHp2 and several promoters known to be controlled by SigB or SigH respectively. The underlined sequence in dpsA promoter indicates putative −35 sequences and arrows indicate modifications from consensus −10 sequence.
Figure 2
Figure 2. Quantification of dpsA transcript abundance in response to osmotic stress.
qRT PCR monitoring dpsA expression levels after induction by 250 mM KCL in S. coelicolor M145 and sigB, sigH, sigM, sigN, sigF, sigK, sigI and sigB/H (inset) mutants (A). dpsA expression in S. coelicolor M145, sigB, sigH and sigB/H mutants after 1 hour of incubations at 42°C (B). * indicates significant differences with equivalent S. coelicolor M145 sample (One Way Anova, P<0.05). Broken Y axis has been used. Error bars indicate standard deviation.
Figure 3
Figure 3. sigH osmotic induction depends on SigB-like factors.
qRT PCR monitoring sigH expression levels after induction by 250 mM KCL for 1 hour in S. coelicolor M145, sigB , sigM , and sigK strains. Error bars indicate standard deviation.
Figure 4
Figure 4. Negative DNA super-coiling contributes to dpsAp induction by osmotic stress.
A: Increasing concentrations of novobiocin abolish DpsAHis induction in the presence of osmotic stress but basal expression levels remain unchanged. B: Heat dependent induction of DpsAHis is independent of novobiocin treatment. S. coelicolor dpsA /pDpsA7H was used for both experiments. Time indicates incubation period under stress in the presence or absence of novobiocin at concentrations shown. C: qRT PCR showing decrease in salt-induced dpsA transcript abundance in response to novobiocin treatment. dpsB and sigB transcript abundance under the same conditions was also determined. Error bars indicate standard deviation.
Figure 5
Figure 5
Developmentally controlled expression of dpsA in S. coelicolor M145, sigB , sigF , sigK and sigB/H strains assessed by qRT PCR (A). Bright field and corresponding fluorescence image showing DpsAmCh expression in aerial hyphae of S. coelicolor M145, whiG and whiB strains. Bar: 10 µm (B). qRT PCR showing dpsA transcript abundance in vegetative and aerial hyphae of S. coelicolor M145 and whiB mutant. Error bars indicate standard deviation. (C). Immunoblot comparing DpsAHis abundance in S. coelicolor M145 and whiB strain throughout the developmental life cycle. Similar amounts of total protein were loaded in each lane (D).
Figure 6
Figure 6. Increasing concentrations of apoWhiB causes electrophoretic shift of dpsAp region.
A double-stranded oligonucleotide containing the OctA2 binding site was used as negative control (A). qRT PCR monitoring dpsA expression levels in S. coelicolor M145 and whiB mutant in response to osmotic stress (B) and heat stress (C). Significant differences in dpsA expression levels (One way Anova, P<0.05) were detected between S. coelicolor M145 and whiB strain after 1 hour of osmotic stress (*). Error bars indicate standard deviation.
Figure 7
Figure 7. Model depicting the regulatory network controlling dpsA expression.
Only stress induced elements are shown. Solid lines indicate experimentally verified relationships (direct and indirect) while the dotted line indicates a partially verified one.

References

    1. Hecker M, Pane-Farre J, Volker U. SigB-dependent general stress response in Bacillus subtilis and related gram-positive bacteria. Annu Rev Microbiol. 2007;61:215–36. - PubMed
    1. Lee EJ, Karoonuthaisiri N, Kim HS, Park JH, Cha CJ, et al. A master regulator sigmaB governs osmotic and oxidative response as well as differentiation via a network of sigma factors in Streptomyces coelicolor. Mol Microbiol. 2005;57:1252–64. - PubMed
    1. Cho YH, Lee EJ, Ahn BE, Roe JH. SigB, an RNA polymerase sigma factor required for osmoprotection and proper differentiation of Streptomyces coelicolor. Mol Microbiol. 2001;42:205–14. - PubMed
    1. Viollier PH, Kelemen GH, Dale GE, Nguyen KT, Buttner MJ, et al. Specialized osmotic stress response systems involve multiple SigB-like sigma factors in Streptomyces coelicolor. Mol Microbiol. 2003;47:699–714. - PubMed
    1. Vohradsky J, Li XM, Dale G, Folcher M, Nguyen L, et al. Developmental control of stress stimulons in Streptomyces coelicolor revealed by statistical analyses of global gene expression patterns. J Bacteriol. 2000;182:4979–86. - PMC - PubMed

Publication types

MeSH terms

Substances