. 2012 Jan;109(1):309-19.
doi: 10.1093/aob/mcr254. Epub 2011 Oct 10.

Totomatix: a novel automatic set-up to control diurnal, diel and long-term plant nitrate nutrition

Affiliations

Totomatix: a novel automatic set-up to control diurnal, diel and long-term plant nitrate nutrition

Stéphane Adamowicz et al. Ann Bot. 2012 Jan.

Abstract

Background: Stand-alone nutritional set-ups are useful tools to grow plants at defined nutrient availabilities and to measure nutrient uptake rates continuously, in particular that for nitrate. Their use is essential when the measurements are meant to cover long time periods. These complex systems have, however, important drawbacks, including poor long-term reliability and low precision at high nitrate concentration. This explains why the information dealing with diel dynamics of nitrate uptake rate is scarce and concerns mainly young plants grown at low nitrate concentration.

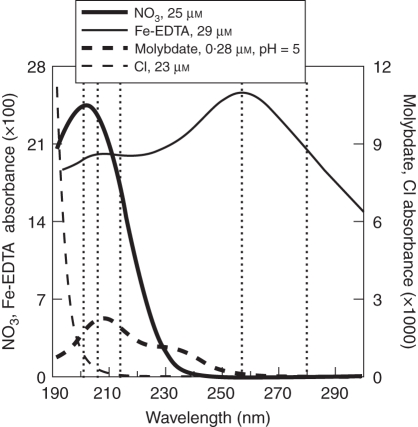
Scope: The novel system detailed in this paper has been developed to allow versatile use in growth rooms, greenhouses or open fields at nitrate concentrations ranging from a few micro- to several millimoles per litres. The system controls, at set frequencies, the solution nitrate concentration, pH and volumes. Nitrate concentration is measured by spectral deconvolution of UV spectra. The main advantages of the set-up are its low maintenance (weekly basis), an ability to diagnose interference or erroneous analyses and high precision of nitrate concentration measurements (0·025 % at 3 mm). The paper details the precision of diurnal nitrate uptake rate measurements, which reveals sensitivity to solution volume at low nitrate concentration, whereas at high concentration, it is mostly sensitive to the precision of volume estimates.

Conclusions: This novel set-up allows us to measure and characterize the dynamics of plant nitrate nutrition at high temporal resolution (minutes to hours) over long-term experiments (up to 1 year). It is reliable and also offers a novel method to regulate up to seven N treatments by adjusting the daily uptake of test plants relative to controls, in variable environments such as open fields and glasshouses.


Figures

Fig. 1.
Fig. 1.
Overview of the culture system showing (A) a solution tank with peripheral equipment and (B) the ‘Totomatix’ analytical set-up. Key: arrows = flow direction; 1 = solution tank; 2 = cooling coil; 3 = pump; 4a = injection line to plants; 4b = drainage from plants; 5 = manual flow valve; 6a,b = bypass to analytical set-up; 7 = manual flow valve; 8 = charcoal filter; 9 = flow-through cell with pH probe; 10 = filter; 11 = micro-pump; 12 = spectrophotometer with flow-through cuvettes; 13 = acid stock solution; 14 & 18 = motorized syringe drives; 15 & 19 = eight-way motorized selection valves; 16 & 20 = manual three-way valves; 17 = nitrate stock solution; 21 = deionized water inlet; 22 = on/off solenoid valve; 23 = flowmeter; 24 = siphon with level sensor.
Fig. 2.
Fig. 2.
UV spectra of optically active nutrients (190–300 nm; 2 nm spectral resolution; 1 cm optical path): NO3 and Fe-EDTA (left axis), molybdate and Cl (right axis), as indicated in the key. Vertical dotted lines denote the wavelengths selected for spectral deconvolution.
Fig. 3.
Fig. 3.
Time course changes of (A) nitrate concentration Cm, (B) mean spectral error E and (C) transformed error Et of four nutrient solutions. Note the vertical axis breaks and uneven scales in (A) and (B). Conditions: four tanks of 500 L nutrient solution (pH = 5), each feeding 11 peach trees in a hydroponic orchard; nitrate analyses = 1- h interval; nitrate set points = 1 mm (pink and blue) or 0·025 mm (red and black); optical paths = 0·5 mm (pink and blue) or 10 mm (red and black). Other major nutrients (mm): K = 3, Ca = 3·5, Mg = 1·5, H2PO4 = 1, SO4 = 6−formula image. Micronutrients as in Table 2.
Fig. 4.
Fig. 4.
Temporal changes in the measured nitrate concentration (Cm, in percentage of set point Csp) and in the volume of injected stock nitrate (IN, mL). (A) Sequence of events recorded at 3-h time intervals over a 16-h period; (B) the same Cm data plotted together with intermediate analyses made in the absence of regulation at 20-min intervals over the period 7–10 h. Conditions: 27 plants feeding on 80 L of full solution (Csp = 0·5 mm NO3) in a glasshouse, solution temperature = 23 °C, 32 d after sowing.
Fig. 5.
Fig. 5.
Drift in the measured nitrate concentration after the final harvest of 92 tomato plants grown at Csp = 3·0 mm and Vsp = 33 L. Conditions: growth room with lights off, nitrate, pH and volume regulations off, air and solution temperature = 20 °C. Regression line: [NO3] = 2·99987 + 0·00069 × time (R2 = 0·952).
Fig. 6.
Fig. 6.
Effect of the time interval between analyses (min) on the precision of plant nitrate uptake rate (ΔF, μmol h−1) calculated from eqn (15) with n = 92 plants, Csp = 3 mm (A,B) and 0·1 mm (C,D). In (A) and (C), effect of volume precision ΔVsp = 0·04 L (dotted line), 0·08 L (thin solid line) and 0·12 L (thick solid line), with Vsp = 66 L. In (B) and (D), effect of total volume Vsp = 33 L (dotted line), 66 L (thin solid line) and 99 L (thick solid line), with ΔVsp = 0·08 L.
Fig. 7.
Fig. 7.
Temporal variation of (A) individual plant nitrate uptake rate F and (B) water additions per tank. Conditions: growth room with 12 h photoperiod, 370 µmol m−2 s−1 photosynthetic photon flux density during day, air and solution temperature = 20 °C, n = 92 plants, Vsp = 30 L, Csp = 3·0 mm. Other major nutrients (mm): K = 3, Ca = 3·5, Mg = 1·5, H2PO4 = 1, SO4 = 4·5. Micronutrients as in Table 2. In (A), F was calculated either from eqns (2) and (9) (open symbols, dashed line) or from eqns (9) and (17) (closed symbols, solid line). The shaded areas denote the night periods.

References

    1. Adamowicz S, Le Bot J. Trends in modelling nitrate uptake. Acta Horticulturae. 1999;507:231–239.
    1. Adamowicz S, Le Bot J. Altering young tomato plant growth by NO3 and CO2 preserves the proportionate relation linking long-term organic-nitrogen accumulation to intercepted radiation. New Phytologist. 2008;180:663–672. - PubMed
    1. Alloush GA, Sanders FE. Responses of chickpea (Cicer arietinum) to iron stress measured using a computer-controlled continuous-flow hydroponic system. In: van Beusichem ML, editor. Plant nutrition – physiology and applications – Proceedings of the Eleventh International Plant Nutrition Colloquium, 30 July–4 August 1989, Wageningen, The Netherlands. Dordrecht: Kluwer Academic Publishers; 1990. pp. 197–206.
    1. André M, Daguenet A, Massimino D, Vivoli JP, Richaud C. Le laboratoire C23A. Un outil au service de la physiologie de la plante entière. I.- Les chambres de culture et les systèmes de mesures associés. Annales Agronomiques. 1979;30:139–151.
    1. Andriolo JL, Le Bot J, Gary C, et al. An experimental set-up to study carbon, water, and nitrate uptake rates by hydroponically grown plants. Journal of Plant Nutrition. 1996;19:1441–1462. - PubMed