. 2011 Dec 23;286(51):43830-43841.
doi: 10.1074/jbc.M111.282715. Epub 2011 Oct 10.

Molecular dissection of Cl--selective Cys-loop receptor points to components that are dispensable or essential for channel activity

Affiliations

Molecular dissection of Cl--selective Cys-loop receptor points to components that are dispensable or essential for channel activity

Dekel D Bar-Lev et al. J Biol Chem. .

Abstract

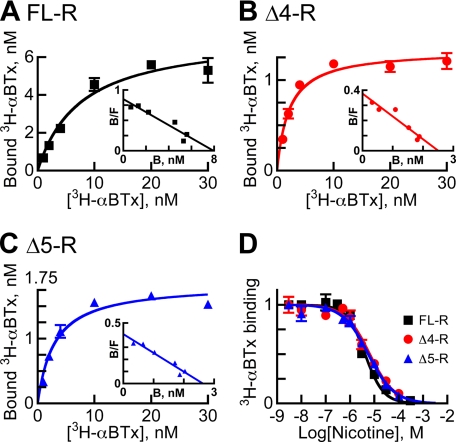
Cys-loop receptors are pentameric ligand-gated ion channels (pLGICs) that bind neurotransmitters to open an intrinsic transmembrane ion channel pore. The recent crystal structure of a prokaryotic pLGIC from the cyanobacterium Gloeobacter violaceus (GLIC) revealed that it naturally lacks an N-terminal extracellular α helix and an intracellular domain that are typical of eukaryotic pLGICs. GLIC does not respond to neurotransmitters acting at eukaryotic pLGICs but is activated by protons. To determine whether the structural differences account for functional differences, we used a eukaryotic chimeric acetylcholine-glutamate pLGIC that was modified to carry deletions corresponding to the sequences missing in the prokaryotic homolog GLIC. Deletions made in the N-terminal extracellular α helix did not prevent the expression of receptor subunits and the appearance of receptor assemblies on the cell surface but abolished the capability of the receptor to bind α-bungarotoxin (a competitive antagonist) and to respond to the neurotransmitter. Other truncated chimeric receptors that lacked the intracellular domain did bind ligands; displayed robust acetylcholine-elicited responses; and shared with the full-length chimeric receptor similar anionic selectivity, effective open pore diameter, and unitary conductance. We suggest that the integrity of the N-terminal α helix is crucial for ligand accommodation because it stabilizes the intersubunit interfaces adjacent to the neurotransmitter-binding pocket(s). We also conclude that the intracellular domain of the chimeric acetylcholine-glutamate receptor does not modulate the ion channel conductance and is not involved in positioning of the pore-lining helices in the conformation necessary for coordinating a Cl- ion within the intracellular vestibule of the ion channel pore.


Figures

FIGURE 1.
FIGURE 1.
Structural properties of pLGICs used here. A, schematic representations of the FL and truncated (Δ1–Δ9) α7-GluClβ chimeric subunits. Blue and reddish segments belong to the N-terminal part (underLigBD” in A), which forms the extracellular ligand-binding domain upon receptor assembly. The blue segment represents the α1 helix. The green and black segments (underPore” in A) belong to the C-terminal part whose helices M1– M4 form the transmembrane ion channel domain upon receptor assembly (numbered 1–4 in the uppermost scheme). The long intracellular M3-M4 linker is depicted as an elongated black box in the FL, Δ1–Δ3, and Δ8 subunits. B, side view of a homology model of the chimeric Δ4-R. For clarity, one of five subunits is colored as in A. Transmembrane helices are numbered 1–4 in one of the gray-colored subunits. M3-M4 linkers of two adjacent subunits are indicated. C, amino acid sequences N-terminal to M4. MA helices are underlined. Colored residues in the M3-M4 linkers were implicated previously in modulation of ion channel conductance. nAChRα1, -β1, -α4, and -β2 are subunits of cationic nicotinic acetylcholine receptors; α1 (UniProtKB accession number P02711) and β1 (Q6S3I0) are from Torpedo marmorata, and α4 (B7ZBU7) and β2 (Q9R291) are from mouse. 5HT3A and 5HT3B are subunits 3A (Q9UEP2) and 3B (O95264) of the cationic human serotonin receptor. GlyRα1 is the α1 subunit of an anionic human glycine receptor (Q14C71). GluClβ is the β subunit of a Cl-selective glutamate receptor from Caenorhabditis elegans (Q17328). D, helical wheel representations of the predicted MA helices of the GluClβ (left) and GlyRα1 (right) subunits. Asterisks indicate the GlyRα1 residues that were implicated in modulation of ion channel conductance. Helical folds were predicted by SYMPRED (supplemental Fig. S3). Amino acids colored in blue, red, cyan, and orange (in C and D) correspond to basic, acidic, polar uncharged, and nonpolar residues, respectively.
FIGURE 2.
FIGURE 2.
[3H]αBTx binding to live cells transfected with FL or truncated (Δ1–Δ9) α7-GluClβ chimeric subunits. Total binding (in the absence of nicotine) is depicted by the black columns, and nonspecific binding (in the presence of 2 mm nicotine) is depicted by the gray columns. “Ctrl” represents control binding to cells transfected with a plasmid encoding CD8, which is an unrelated transmembrane protein. HEK cells and 30 nm [3H]αBTx were used. The error bars correspond to S.D. Student's t tests, which compared toxin binding in the absence and presence of nicotine, gave p < 10−8 for cells transfected with the FL and truncated Δ4 and Δ5 chimeric subunits and p > 0.1 for cells transfected with an unrelated CD8 protein and the truncated Δ1–Δ3 and Δ6–Δ9 chimeric subunits.
FIGURE 3.
FIGURE 3.
Ligand binding studies with FL-R, Δ4-R, and Δ5-R. A–C, representative saturation curves of [3H]αBTx binding to the chimeric receptors indicated in the panels. Insets correspond to Scatchard curves. D, inhibition of [3H]αBTx binding to the receptors indicated inside the panel by nicotine. KD concentrations of [3H]αBTx were used in D. Curves were fitted to the data points by a nonlinear regression using either Equation 1 (A–C) or Equation 2 (D). Error bars correspond to S.D. B, bound; F, free.
FIGURE 4.
FIGURE 4.
Immunoblot of full-length and truncated α7-GluClβ chimeric subunits. HA was fused to the N terminus of the subunits indicated under the “HA-taggedbar following by expression in HEK cells. Membrane preparations were analyzed by SDS-PAGE and Western blotting using anti-HA antibodies. Untagged full-length receptor was analyzed as a control for the specificity of the anti-HA antibodies (FL; first lane on the left). The arrowhead in the left panel points to ∼52 kDa approximately where the doublet band migrated. The oblique gray arrowhead in the right panel points to ∼48 kDa where the HA-Δ4 and HA-Δ5 subunits migrated. The left and right asterisks (in the right panel) indicate the place where the non-degraded portions of the HA-Δ6 (∼35 kDa) and HA-Δ8 (∼44 kDa) subunits migrated, respectively. Molecular masses of the HA-tagged chimeric subunits (HA-FL, -Δ1, -Δ2, -Δ3, -Δ9, -Δ4, -Δ5, -Δ6, -Δ7, and -Δ8) as calculated based on amino acid composition are 47.2, 45.6, 46.0, 46.2, 39.0, 40.5, 40.8, 32.6, 36.0, and 42.6 kDa, respectively. Note that aggregation and degradation products were observed (discussed under “Results”).
FIGURE 5.
FIGURE 5.
Expression of chimeric α7-GluClβ receptors on cell surface of live cells. A, labeling of the surface of an HEK cell expressing HA-tagged full-length α7-GluClβR (HA-FL-R) with Rd-αBTx (red) or anti-HA antibodies (green). Co-localization is demonstrated by merging the two left panels (Rd-αBTx + Anti-HA; yellow). The right-most panel shows a differential interference contrast (DIC) microscopy image of the cell. B, binding of anti-HA antibodies (green) to the surface of cells expressing HA-tagged chimeric receptors that lack the α1 helix (HA-Δ1-R, HA-Δ2-R, and HA-Δ3-R). The lower panels show differential interference contrast images of the cells. C, Rd-αBTx binding (red) to the surface of cells expressing the untagged FL-R, Δ4-R, and Δ5-R. The lower panels show differential interference contrast images of the cells. White bars correspond to 10 μm.
FIGURE 6.
FIGURE 6.
Receptor-channel activity of full-length and two truncated α7-GluClβ chimeric receptors. Representative traces of ACh-evoked currents in HEK cells expressing FL-R (A), Δ4-R (B), and Δ5-R (C) are shown. Current recordings were preformed in the whole-cell configuration of the patch clamp technique at −60 mV and at room temperature (RT). ACh concentrations in micromolar are indicated above the application black bars. D, averaged dose-response curves for the currents elicited by ACh in cells expressing the chimeric receptors indicated inside the panel. Curves were fitted to the averaged data points with a non-linear regression using the Hill equation (Equation 3) (r2 = 0.98, 0.99, and 0.99 for FL-R, Δ4-R, and Δ5-R, respectively). The error bars correspond to S.E.
FIGURE 7.
FIGURE 7.
Ionic selectivity of FL-R and Δ4-R. A and B, left, representative current (I)-voltage (V) relations for the indicated chimeric receptors. Examples for the maximal shifts in Erev values as observed when measurements were performed with an external solution containing 140 mm NaCl (gray) compared with an external solution containing mannitol instead of NaCl (black). A and B, right, Erev values plotted as a function of external Cl activities for the indicated chimeric receptors. Curves were fitted to the data points with a non-linear regression using the Goldman-Hodgkin-Katz equation (Equation 5) (r2 > 0.99 for both). Error bars correspond to S.E. Erev values in the right panels were corrected to account for the liquid junction potentials (see “Experimental Procedures” for details). Ionic permeability ratios are provided in Table 3.
FIGURE 8.
FIGURE 8.
Analysis of single channel conductance for FL-R and Δ4-R. A and B, left, representative single channel currents recorded in cell-attached patches of the indicated chimeric receptors. Measurements were performed at the indicated holding voltages that correspond to the inverted voltage command (−VC). The closed state level is indicated by C (left of each current trace), and openings are upward or downward deflections. Horizontal black bars correspond to 20 ms. A and B, right, event amplitude histograms for the single channel currents. The event amplitude histograms were fitted with two Gaussian functions (Equation 6); one represents the closed state, and the other represents the open state. C, mean currents obtained from the Gaussian fits are plotted as a function of holding voltages (error bars correspond to ±S.D.). Current (I)-voltage (V) curves represent linear fits to the data points (r2 > 0.99 for both) with slopes corresponding to the single channel conductances, which are 25 and 27 picosiemens for FL-R and Δ4-R, respectively.

References

    1. Karlin A. (2002) Nat. Rev. Neurosci. 3, 102–114 - PubMed
    1. Lester H. A., Dibas M. I., Dahan D. S., Leite J. F., Dougherty D. A. (2004) Trends Neurosci. 27, 329–336 - PubMed
    1. Colquhoun D., Sivilotti L. G. (2004) Trends Neurosci. 27, 337–344 - PubMed
    1. Betz H., Laube B. (2006) J. Neurochem. 97, 1600–1610 - PubMed
    1. Sine S. M., Engel A. G. (2006) Nature 440, 448–455 - PubMed

Publication types

LinkOut - more resources