. 2011 Nov 15;187(10):5370-9.
doi: 10.4049/jimmunol.1102111. Epub 2011 Oct 10.

Disruption of nitric oxide signaling by Helicobacter pylori results in enhanced inflammation by inhibition of heme oxygenase-1

Affiliations

Disruption of nitric oxide signaling by Helicobacter pylori results in enhanced inflammation by inhibition of heme oxygenase-1

Alain P Gobert et al. J Immunol. .

Abstract

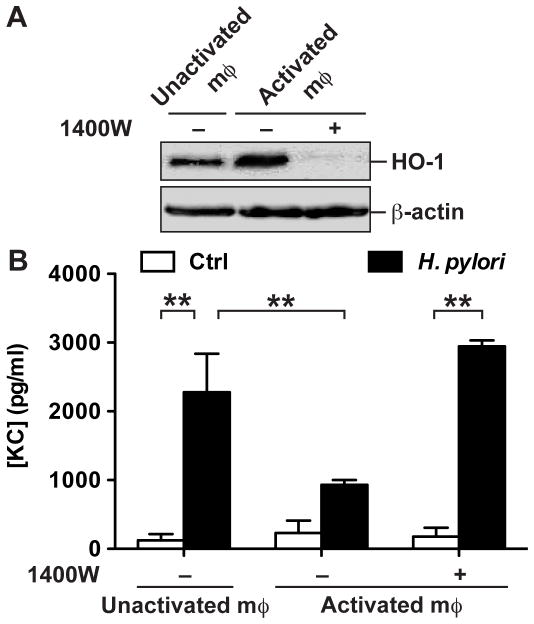
A strong cellular cross-talk exists between the pathogen Helicobacter pylori and high-output NO production. However, how NO and H. pylori interact to signal in gastric epithelial cells and modulate the innate immune response is unknown. We show that chemical or cellular sources of NO induce the anti-inflammatory effector heme oxygenase-1 (HO-1) in gastric epithelial cells through a pathway that requires NF-κB. However, H. pylori decreases NO-induced NF-κB activation, thereby inhibiting HO-1 expression. This inhibitory effect of H. pylori results from activation of the transcription factor heat shock factor-1 by the H. pylori virulence factor CagA and by the host signaling molecules ERK1/2 and JNK. Consistent with these findings, HO-1 is downregulated in gastric epithelial cells of patients infected with cagA(+) H. pylori but not in gastric epithelial cells of patients infected with cagA(-) H. pylori. Enhancement of HO-1 activity in infected cells or in H. pylori-infected mice inhibits chemokine generation and reduces inflammation. These data define a mechanism by which H. pylori favors its own pathogenesis by inhibiting HO-1 induction through the action of CagA.


Figures

FIGURE 1
FIGURE 1
Effect of NO and H. pylori on HO-1 induction in gastric epithelial cells. A and B, hmox-1 mRNA expression. AGS (A) or Imst (B) cells were treated with NOR4 and/or infected for 6 h with H. pylori (Hp) strain 60190 or 7.13, respectively. RNA was purified, reverse transcribed, and the expression of hmox-1 was analyzed by real-time PCR; n = 5. C, The presence of the HO-1 and β-actin proteins was detected by Western blotting in cellular extract of AGS cells stimulated for 6, 12, or 18 h with NOR4 and/or H. pylori. Representative data of 3 independent experiments. D, Densitometric analysis of Fig. 1C; n = 3.
FIGURE 2
FIGURE 2
Inhibition of NO-induced hmox-1 expression by H. pylori requires CagA. A, Expression of hmox-1 in AGS cells stimulated with NOR4, and infected or not with WT H. pylori or various mutant strains. Values obtained for infected cells treated with NOR4 were compared to cells treated with NOR4 alone; n = 3. B, Expression of hmox-1 in AGS cells transfected with pSP65SRα plasmid vector, pWT-cagA, or pPR-cagA, and treated with NOR4. Values obtained for transfected cells treated with NOR4 were compared to cells not transfected and treated with NOR4; n = 3. C and D, Effect of the Src inhibitor PP1. AGS cells were treated with PP1 for 30 min prior to stimulation with NOR4 ± H. pylori for 6 h. CagA phosphorylation was assessed by Western blot using the PY99 Ab (C). Expression of hmox-1 mRNA was assessed by real-time PCR; values obtained for infected cells treated with NOR4 were compared to cells treated with NOR4 alone (D); n = 3. E, Expression of hmox-1 in Imst cells stimulated with NOR4, and infected or not with H. pylori 7.13 or PMSS1 or with the corresponding mutant strains. Values obtained for infected cells treated with NOR4 were compared to cells treated with NOR4 alone; n = 3.
FIGURE 3
FIGURE 3
HO-1 levels are decreased in patients infected with cagA+ H. pylori. A, Expression of hmox-1 in gastric tissues with histologically normal mucosa and from subjects infected with cagA+ or cagA− strains of H. pylori; n = 8 cases per group. B, Representative HO-1 immunoperoxidase staining in gastric tissues. C, Quantification of staining score for HO-1 in gastric epithelium on a 0–300 scale; n = 10 cases per group. D, HO-1 staining and histologic gastritis scores were plotted for each patient. The linear regression line, the correlation coefficient (r), and the p value are shown.
FIGURE 4
FIGURE 4
Regulation of hmox-1 transcription by NO and H. pylori. A, Pharmacological inhibition of signaling pathways. AGS cells were pretreated with Bay11–7082 (Bay), LY294002 (LY), PD98059 (PD), ERKi, SP600125 (SP), SB203580 (SB), or HIFi 30 min prior to adding NOR4 ± H. pylori for 6 h. Expression of hmox-1 mRNA was analyzed by real-time PCR; n = 5. B, MAPK silencing. AGS cells transfected with lmnA, ERK1/2, JNK or p38 siRNAs were treated with NOR4 ± H. pylori. Expression of hmox-1 was performed by real-time PCR; n = 3.
FIGURE 5
FIGURE 5
H. pylori-induced HSF1 dowregulates hmox-1 expression. AGS cells were transfected with siRNAs directed against hsf1 or lmnA and then treated with NOR4 and/or H. pylori. The levels of hmox-1 mRNA (A; 6 h) and HO-1 protein (B; 18 h) were assessed by real-time PCR and Western blotting, respectively; n = 4 for (A), and (B) is the representative data of 3 independent experiments. C, AGS cells, transfected with hsf1 or lmnA siRNAs, were treated for 6 h with NOR4 ± H. pylori, with or without the NF-κB inhibitor Bay 11–7082 (Bay). The level of hmox-1 transcripts was analyzed by real-time PCR; n = 4.
FIGURE 6
FIGURE 6
H. pylori activates HSF1. A, Immunodetection of p-HSF1 on Ser326 and total HSF1 in AGS cells exposed to NOR4 and/or H. pylori. B, AGS cells pretreated with ERKi, SP600125 (SP), or SB203580 (SB) were then infected with H. pylori for 1 h; HSF1 phosphorylation was analyzed by Western blotting. C, HSF1 phosphorylation in AGS cells infected for 1 h with H. pylori 60190 WT or with each mutant strain. D, Densitometric analysis of Fig. 6C; n = 3. E, Levels of p-HSF1(Ser326) in cells transfected with pSP65SRα, pWT-cagA, or pPR-cagA.
FIGURE 7
FIGURE 7
H. pylori-induced HSF1 decreases NF-κB activation. AGS cells knockdown for lamin A or HSF1 were treated with NOR4 and/or infected with H. pylori. A, Nuclear p-p65 and cytoplasmic p-IκBα (3 h) were analyzed by Western blotting. B, NF-κB activity was determined in cells expressing the pNF-κB-Luc plasmid; n = 3.
FIGURE 8
FIGURE 8
HO-1 inhibits H. pylori-induced IL-8 generation. A and B, IL-8 mRNA expression (A) and [IL-8] in the culture supernatant (B) of AGS cells pretreated or not with NOR4 and then infected with H. pylori, in the presence or absence of ZnPP; n = 4. C, Same conditions as in (A) with cells transfected or not with hmox-1 or lmnA siRNAs; n = 4. D, IL-8 mRNA expression determined in cells infected with H. pylori ± CORM2 or bilirubin; n = 3.
FIGURE 9
FIGURE 9
Cellular source of NO induces HO-1 and inhibit chemokine release by epithelial cells. A, RAW264.7 macrophages (mφ) were cultured on plates and stimulated or not with IFN-γ for 24 h, washed and exposed to ImSt cells cultured above on 0.2 μm filter supports, in the presence or absence of 5 μM 1400W. After 18 h, HO-1 and β-actin protein levels were analyzed by Western blotting in ImSt cells; data are representative of 2 independent experiments. B, ImSt cells cocultured with macrophages as in A, were then separated from macrophages and infected or not (Ctrl) for 3 h with H. pylori; KC concentrations were measured in the culture supernatants; n = 3.
FIGURE 10
FIGURE 10
Induction of HO-1 by hemin decreases acute inflammation in H. pylori-infected mice. Expression of hmox-1 mRNA (A) and HO-1 staining (B) in the stomach of mice treated or not with hemin ± CrMP and infected with H. pylori PMSS1. Levels of KC mRNA expression (C), and number of PMN cells in an antral section (D); n = 5–8 per group.
FIGURE 11
FIGURE 11
A model for the regulation of expression and the role of HO-1 in H. pylori infection. HO-1 induction in gastric epithelial cells by NO requires NF-κB (a); when HO-1 is expressed in the cells, it blocks IL-8 mRNA expression induced by H. pylori (b). However, the bacterium activates HSF1 through CagA/ERK1/2- and JNK-dependent pathways (c), which inhibits NO-induced NF-κB and hmox-1 mRNA expression (d).

References

    1. Peek RM, Jr, Fiske C, Wilson KT. Role of innate immunity in Helicobacter pylori-induced gastric malignancy. Physiol Rev. 2010;90:831–858. - PMC - PubMed
    1. Blaser MJ, Perez-Perez GI, Kleanthous H, Cover TL, Peek RM, Chyou PH, Stemmermann GN, Nomura A. Infection with Helicobacter pylori strains possessing cagA is associated with an increased risk of developing adenocarcinoma of the stomach. Cancer Res. 1995;55:2111–2115. - PubMed
    1. Ogura K, Maeda S, Nakao M, Watanabe T, Tada M, Kyutoku T, Yoshida H, Shiratori Y, Omata M. Virulence factors of Helicobacter pylori responsible for gastric diseases in Mongolian gerbil. J Exp Med. 2000;192:1601–1610. - PMC - PubMed
    1. Odenbreit S, Puls J, Sedlmaier B, Gerland E, Fischer W, Haas R. Translocation of Helicobacter pylori CagA into gastric epithelial cells by type IV secretion. Science. 2000;287:1497–1500. - PubMed
    1. Selbach M, Moese S, Hauck CR, Meyer TF, Backert S. Src is the kinase of the Helicobacter pylori CagA protein in vitro and in vivo. J Biol Chem. 2002;277:6775–6778. - PubMed

Publication types

MeSH terms