

Population pharmacokinetics and maximum a posteriori probability Bayesian estimator of abacavir: application of individualized therapy in HIV-infected infants and toddlers
- PMID: 21988586
- PMCID: PMC3376440
- DOI: 10.1111/j.1365-2125.2011.04121.x
Population pharmacokinetics and maximum a posteriori probability Bayesian estimator of abacavir: application of individualized therapy in HIV-infected infants and toddlers
Abstract
What is already known about this subject: Abacavir is used to treat HIV infection in both adults and children. The recommended paediatric dose is 8 mg kg(-1) twice daily up to a maximum of 300 mg twice daily. Weight was identified as the central covariate influencing pharmacokinetics of abacavir in children.
What this study adds: A population pharmacokinetic model was developed to describe both once and twice daily pharmacokinetic profiles of abacavir in infants and toddlers. Standard dosage regimen is associated with large interindividual variability in abacavir concentrations. A maximum a posteriori probability Bayesian estimator of AUC(0-) (t) based on three time points (0, 1 or 2, and 3 h) is proposed to support area under the concentration-time curve (AUC) targeted individualized therapy in infants and toddlers.
Aims: To develop a population pharmacokinetic model for abacavir in HIV-infected infants and toddlers, which will be used to describe both once and twice daily pharmacokinetic profiles, identify covariates that explain variability and propose optimal time points to optimize the area under the concentration-time curve (AUC) targeted dosage and individualize therapy.
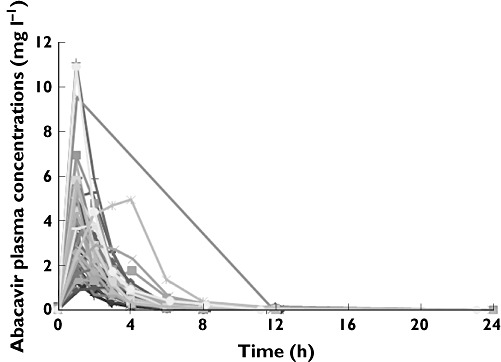
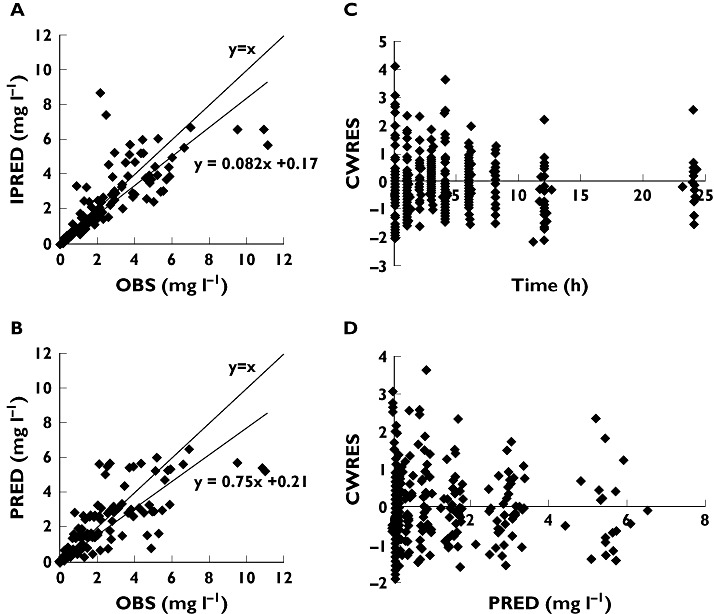
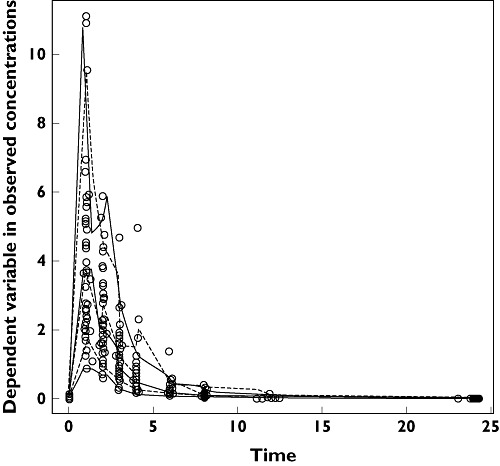
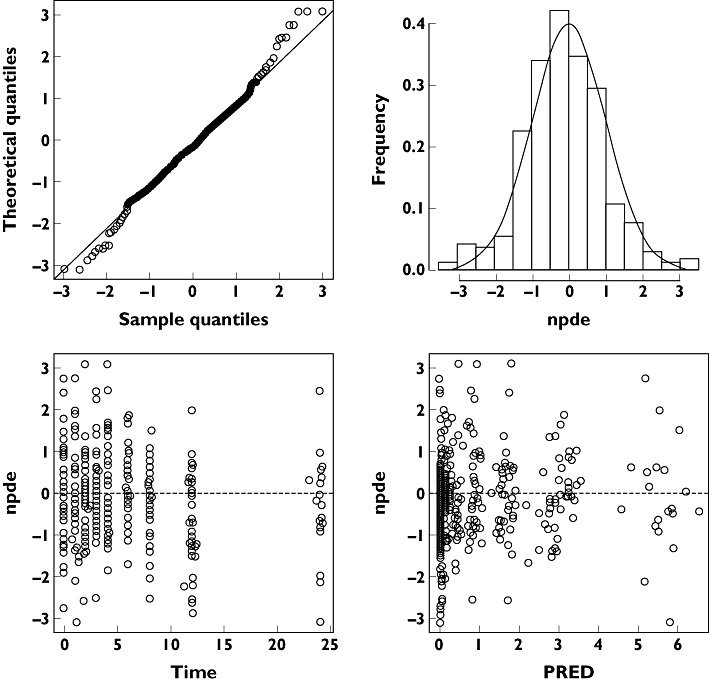
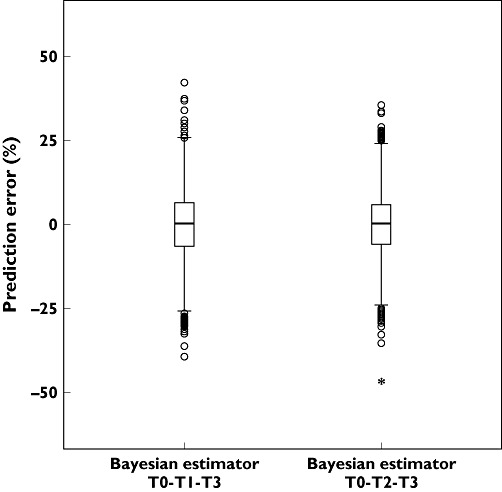
Methods: The pharmacokinetics of abacavir was described with plasma concentrations from 23 patients using nonlinear mixed-effects modelling (NONMEM) software. A two-compartment model with first-order absorption and elimination was developed. The final model was validated using bootstrap, visual predictive check and normalized prediction distribution errors. The Bayesian estimator was validated using the cross-validation and simulation-estimation method.
Results: The typical population pharmacokinetic parameters and relative standard errors (RSE) were apparent systemic clearance (CL) 13.4 () h−1 (RSE 6.3%), apparent central volume of distribution 4.94 () (RSE 28.7%), apparent peripheral volume of distribution 8.12 () (RSE14.2%), apparent intercompartment clearance 1.25 () h−1 (RSE 16.9%) and absorption rate constant 0.758 h−1 (RSE 5.8%). The covariate analysis identified weight as the individual factor influencing the apparent oral clearance: CL = 13.4 × (weight/12)1.14. The maximum a posteriori probability Bayesian estimator, based on three concentrations measured at 0, 1 or 2, and 3 h after drug intake allowed predicting individual AUC0–t.
Conclusions: The population pharmacokinetic model developed for abacavir in HIV-infected infants and toddlers accurately described both once and twice daily pharmacokinetic profiles. The maximum a posteriori probability Bayesian estimator of AUC(0-) (t) was developed from the final model and can be used routinely to optimize individual dosing.
© 2011 The Authors. British Journal of Clinical Pharmacology © 2011 The British Pharmacological Society.
Figures
References
-
- PENTA Steering Committee. Welch S, Sharland M, Lyall EG, Tudor-Williams G, Niehues T, Wintergerst U, Bunupuradah T, Hainaut M, Della Negra M, Pena MJ, Amador JT, Gattinara GC, Compagnucci A, Faye A, Giaquinto C, Gibb DM, Gandhi K, Forcat S, Buckberry K, Harper L, Königs C, Patel D, Bastiaans D. PENTA 2009 guidelines for the use of antiretroviral therapy in paediatric HIV-1 infection. HIV Med. 2009;10:591–613. - PubMed
-
- McDowell JA, Chittick GE, Ravitch JR, Polk RE, Kerkering TM, Stein DS. Pharmacokinetics of [(14)C] abacavir, a human immunodeficiency virus type 1 (HIV-1) reverse transcriptase inhibitor, administered in a single oral dose to HIV-1-infected adults: a mass balance study. Antimicrob Agents Chemother. 1999;43:2855–61. - PMC - PubMed
-
- Yuen GJ, Weller S, Pakes GE. A review of the pharmacokinetics of abacavir. Clin Pharmacokinet. 2008;47:351–71. - PubMed
Publication types
MeSH terms
Substances
Grants and funding
LinkOut - more resources
Full Text Sources
Medical
