. 2011 Oct 11:7:538.
doi: 10.1038/msb.2011.73.

Dissecting the retinoid-induced differentiation of F9 embryonal stem cells by integrative genomics

Affiliations

Dissecting the retinoid-induced differentiation of F9 embryonal stem cells by integrative genomics

Marco A Mendoza-Parra et al. Mol Syst Biol. .

Abstract

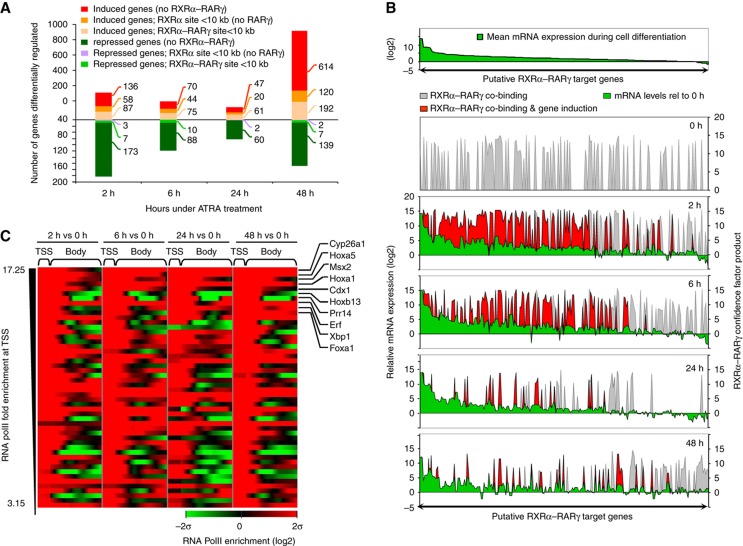
Retinoic acid (RA) triggers physiological processes by activating heterodimeric transcription factors (TFs) comprising retinoic acid receptor (RARα, β, γ) and retinoid X receptor (RXRα, β, γ). How a single signal induces highly complex temporally controlled networks that ultimately orchestrate physiological processes is unclear. Using an RA-inducible differentiation model, we defined the temporal changes in the genome-wide binding patterns of RARγ and RXRα and correlated them with transcription regulation. Unexpectedly, both receptors displayed a highly dynamic binding, with different RXRα heterodimers targeting identical loci. Comparison of RARγ and RXRα co-binding at RA-regulated genes identified putative RXRα-RARγ target genes that were validated with subtype-selective agonists. Gene-regulatory decisions during differentiation were inferred from TF-target gene information and temporal gene expression. This analysis revealed six distinct co-expression paths of which RXRα-RARγ is associated with transcription activation, while Sox2 and Egr1 were predicted to regulate repression. Finally, RXRα-RARγ regulatory networks were reconstructed through integration of functional co-citations. Our analysis provides a dynamic view of RA signalling during cell differentiation, reveals RAR heterodimer dynamics and promiscuity, and predicts decisions that diversify the RA signal into distinct gene-regulatory programs.


Conflict of interest statement

The authors declare that they have no conflict of interest.

Figures

Figure 1
Figure 1
RXRα and RARγ nuclear receptors present a highly dynamic binding to chromatin during ATRA-induced F9 differentiation. (A) Uniquely aligned reads sequenced from samples associated with the different time points were combined and processed to generate a meta-binding profile. The percent of RXRα and RARγ co-occupancy relative to the total number of binding sites in their corresponding metaprofile is illustrated for different P-value confidence thresholds (CT=−10 × log (P-value)). The inset (Venn diagram) shows that at CT=40 all identified RARγ sites are found co-occupied with RXRα. This subset of binding sites is considered bona fide RXRα–RARγ heterodimer binding sites and has been used for all further analysis. (B) The RXRα–RARγ binding sites identified in (A) are illustrated in the context of their temporal recruitment, duration of occupancy and dissociation (CT25). RXRα–RARγ co-occupied sites per time point are subclassified based on their recruitment intervals and depicted by colour coding. (C) Progressive loss of RARγ but not of RXRα from chromatin binding sites during ATRA-induced differentiation. For each time point, the fraction of RXRα–RARγ co-occupied sites relative to those bound by RXRα is represented for two CT values. (D) Examples of ChIP-seq profiles revealing the divergent temporal binding of RXRα and RARγ to the Rarβ promoter region; the corresponding metaprofiles (bottom panels) and the MeDiChI-predicted P-values (heatmaps at the right of each profile) are indicated. (E) ReChIP–qPCR quantification for temporal pattern of RXRα (primary IP) and RARγ (secondary IP) colocalization at the Rarb promoter. Rarγ−/− cells treated with ATRA during 48 h were used to define the background. (F) ReChIP–qPCR as in (E) but using anti-RARα antibodies for the secondary IP; Rarα−/− cells were used as background control. In (E) and (F), the fold occupancy levels were calculated relative to a chromatin region localized at 18 kb downstream of Hoxb1, which corresponds to a ‘cold’ region.
Figure 2
Figure 2
Temporal correlation between RXRα–RARγ heterodimer binding and transcriptional regulation of putative target genes. (A) Genes exhibiting ATRA-induced or repressed mRNA levels at the indicated time points during F9 cell differentiation (induced genes ⩾1.8-fold; repressed genes ⩽0.5-fold relative to vehicle) were classified as putative target genes if gene-proximal RXRα or RXRα–RARγ binding site was present in the CT40 metaprofiles. (B) Top panel: ranking of putative RXRα–RARγ target genes according to the mean of their mRNA expression levels over all four time points relative to 0 h. Bottom panels: illustration of putative RXRα–RARγ target genes ranked as above (green, relative mRNA levels) at each of the five time points during differentiation, overlaid with a display of RXRα and RARγ co-binding at each target, expressed as the product of the corresponding confidence factors (proportional to P-value) (red for genes with fold induction levels ⩾1.8; otherwise grey). (C) RNA polymerase II enrichment at TSSs and gene bodies as assessed by POLYPHEMUS from ChIP-seq assays at the indicated time points and expressed relative to the 0-h sample. The top 50 genes, ranked according to PolII enrichment at their TSSs, are depicted (heatmap range ±2σ standard deviation). Note that the top 10 genes are significantly enriched for TFs.
Figure 3
Figure 3
Temporal (transcription) regulation defines distinct classes of RXRα–RARγ target genes. (A) SOTA classification of putative RXRα–RARγ target genes according to the indicated criteria for RXRα and RARγ binding, co-binding and gene induction reveal four different classes: (i) early induced genes displaying sustained expression over 48 h; (ii) early but transiently induced genes; (iii) early-late transiently induced genes and (iv) late induced gene expression. Only genes that show coordinate heterodimer binding and gene activation at least at one time point are considered. (B) Illustration of putative target genes per class. Genes in bold were previously described as ATRA responsive. Heatmaps on the left (black-yellow gradient) give the P-value confidence for RXRα and RARγ binding to each gene in the metaprofiles. Genes with more than one RXRα–RARγ binding site appear several times; genes in red are validated by ChIP–qPCR and reChIP–qPCR in (D, E). (C) Examples of ChIP-seq profiles per class. RXRα (red) and RARγ (blue) profiles are overlaid and depicted per time point. Heatmaps in the right display P-value confidence as in (B). (D) ChIP–qPCR validation of RXRα and RARγ binding depicted as fold occupancies relative to a ‘cold’ region. (E) ReChIPs to assess co-binding of RXRα with RARγ (black line) or RARα (dashed line).
Figure 4
Figure 4
RXRα–RARγ putative target genes activated by specific RAR agonists. mRNA expression heatmaps of putative RXRα-RARγ target genes illustrate their induction in presence of ATRA or the indicated RAR isotype-selective ligands.
Figure 5
Figure 5
Dynamic regulatory map of ATRA-induced transcriptome. (A) DREM co-expression analysis is represented by colour-coded paths that summarize common characteristics. The number of genes per co-expression path is indicated. Diamonds indicate three predicted bifurcation points (BP1–3); transcription factors (TFs) whose target genes are overenriched in a path are indicated. Node's size reflects the genes’ expression standard deviation assigned to that node. (B) Classification of genes associated with the three paths generated by BP1, by hierarchical clustering of the corresponding temporal transcriptomics data leads to the subclassifications predicted by BP2 and BP3. (C) Transcriptional regulation of TFs associated with BP decisions. (D) Relevant Gene Ontology terms associated with each co-expression path. (E) mRNA expression levels of Laminin α1 (Lama1), Laminin β1 (Lamb1), Laminin γ1 (Lamc1), type IV collagen α1 (Col4a1) in F9 cells transfected with siRNA constructs against TFs associated with BP3 or against Foxa1, a TF induced exclusively by ATRA and BMS961. Expression levels correspond to the mean of three replicates and are displayed relative to those found in GFP-control siRNA-transfected cells. (F) Morphology of siRNA-transfected cells 48 h after ATRA treatment. Transfected cells are identified by fluorescence from co-transfected FAM. Top panels: Hoxb2 or Foxa1 siRNA-transfected ATRA-treated cells. Bottom panels: mock-transfected vehicle-exposed undifferentiated cells and GFP siRNA-transfected ATRA-treated cells, respectively. Note that in the case of Hoxb2 or Foxa1, transfected (fluorescent) cells are less differentiated than adjacent non-transfected cells (bar=25 μm). (G) Blinded semiquantification correlating morphological differentiation status and FAM-derived fluorescence by cell counting; data are the mean of two independent blinded quantifications.
Figure 6
Figure 6
A comprehensive ATRA-RXRα/RARγ signalling network. Genes associated with the different co-expression paths illustrated in Figure 5 are represented in the context of their functional gene co-citation interactions. For simplicity, only the top 100 hubs (coloured nodes) and their first neighbours (white nodes) are shown. Edge's widths correspond to the number of co-citations (limit ⩾5) described between nodes. Hub sizes and colours give the node's ranking based on topology scoring (double screening scheme of Hubba; Lin et al, 2008). This network is available in a Cytoscape format in Supplementary File S1.

Similar articles

Cited by

References

    1. Altucci L, Leibowitz MD, Ogilvie KM, de Lera AR, Gronemeyer H (2007) RAR and RXR modulation in cancer and metabolic disease. Nat Rev Drug Discov 6: 793–810 - PubMed
    1. Ashburner M, Chihara C, Meltzer P, Richards G (1974) Temporal control of puffing activity in polytene chromosomes. Cold Spring Harb Symp Quant Biol 38: 655–662 - PubMed
    1. Bellemere G, Von Stetten O, Oddos T (2008) Retinoic acid increases aquaporin 3 expression in normal human skin. J Invest Dermatol 128: 542–548 - PubMed
    1. Boer B, Kopp J, Mallanna S, Desler M, Chakravarthy H, Wilder PJ, Bernadt C, Rizzino A (2007) Elevating the levels of Sox2 in embryonal carcinoma cells and embryonic stem cells inhibits the expression of Sox2:Oct-3/4 target genes. Nucleic Acids Res 35: 1773–1786 - PMC - PubMed
    1. Cao C, Wan S, Jiang Q, Amaral A, Lu S, Hu G, Bi Z, Kouttab N, Chu W, Wan Y (2008) All-trans retinoic acid attenuates ultraviolet radiation-induced down-regulation of aquaporin-3 and water permeability in human keratinocytes. J Cell Physiol 215: 506–516 - PubMed

MeSH terms