. 2011 Oct 11:5:159.
doi: 10.1186/1752-0509-5-159.

Parameter estimation with bio-inspired meta-heuristic optimization: modeling the dynamics of endocytosis

Affiliations

Parameter estimation with bio-inspired meta-heuristic optimization: modeling the dynamics of endocytosis

Katerina Tashkova et al. BMC Syst Biol. .

Abstract

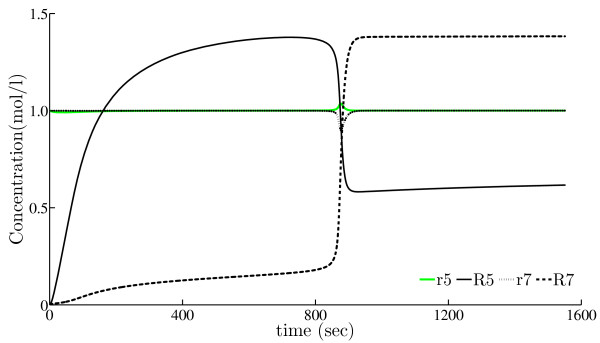
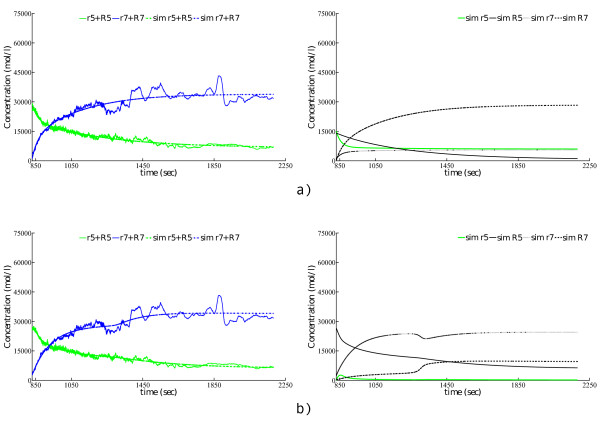
Background: We address the task of parameter estimation in models of the dynamics of biological systems based on ordinary differential equations (ODEs) from measured data, where the models are typically non-linear and have many parameters, the measurements are imperfect due to noise, and the studied system can often be only partially observed. A representative task is to estimate the parameters in a model of the dynamics of endocytosis, i.e., endosome maturation, reflected in a cut-out switch transition between the Rab5 and Rab7 domain protein concentrations, from experimental measurements of these concentrations. The general parameter estimation task and the specific instance considered here are challenging optimization problems, calling for the use of advanced meta-heuristic optimization methods, such as evolutionary or swarm-based methods.

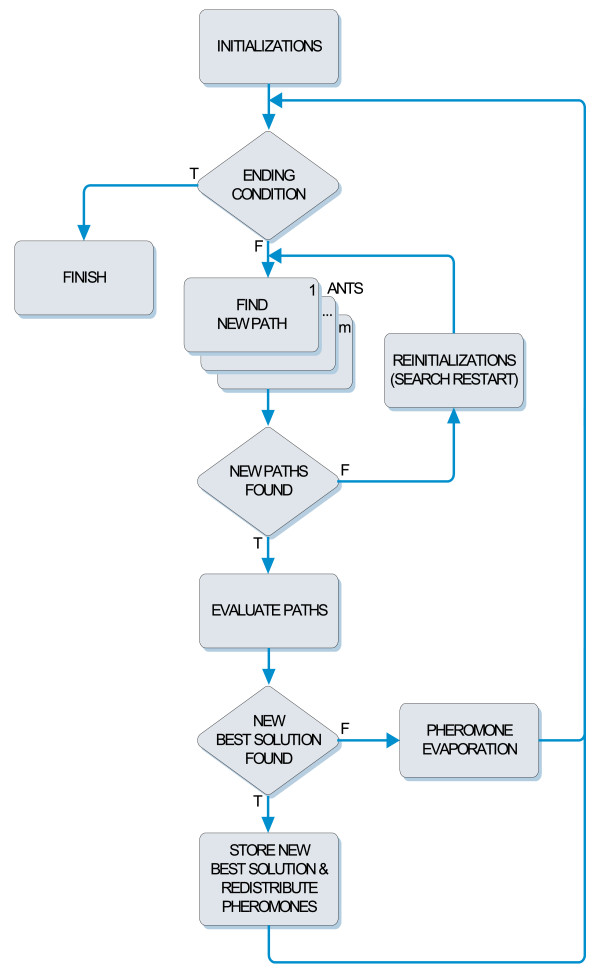
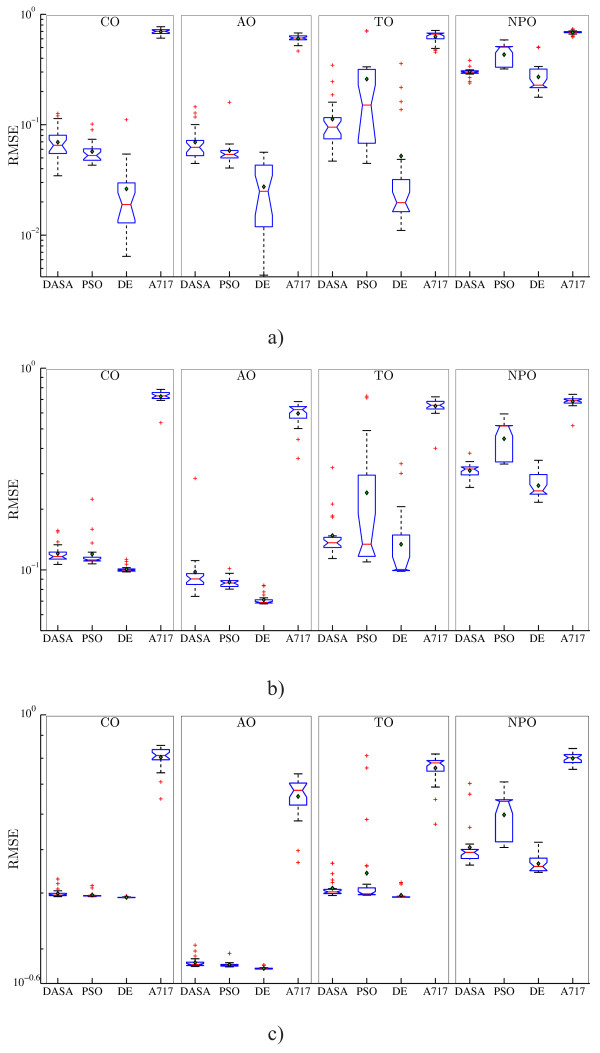
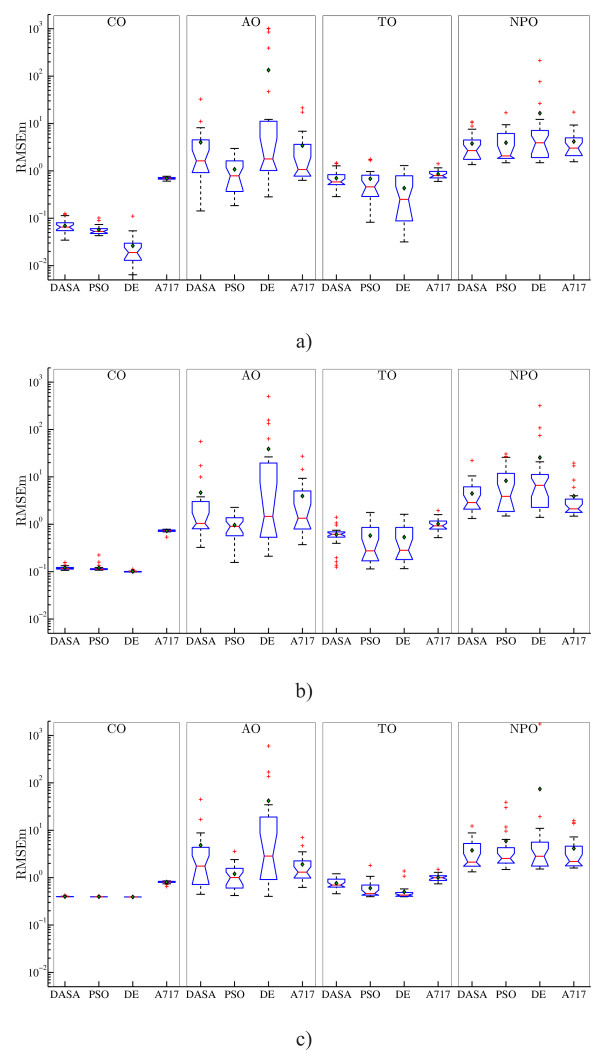
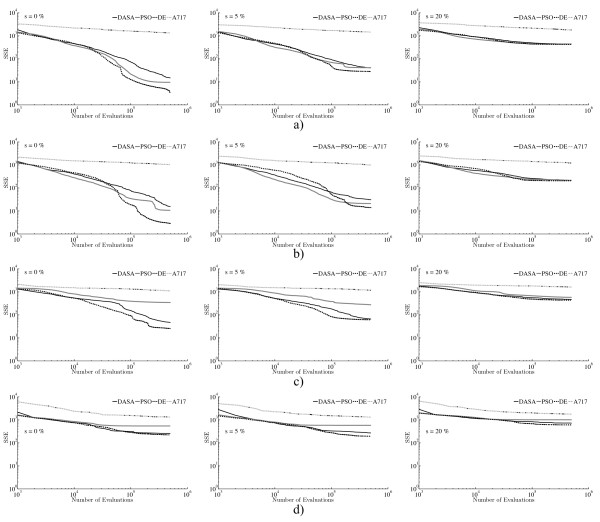
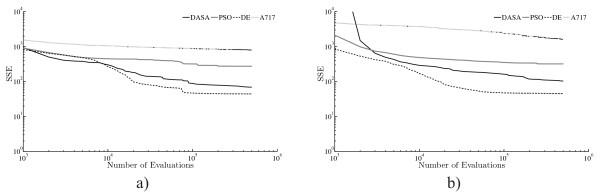
Results: We apply three global-search meta-heuristic algorithms for numerical optimization, i.e., differential ant-stigmergy algorithm (DASA), particle-swarm optimization (PSO), and differential evolution (DE), as well as a local-search derivative-based algorithm 717 (A717) to the task of estimating parameters in ODEs. We evaluate their performance on the considered representative task along a number of metrics, including the quality of reconstructing the system output and the complete dynamics, as well as the speed of convergence, both on real-experimental data and on artificial pseudo-experimental data with varying amounts of noise. We compare the four optimization methods under a range of observation scenarios, where data of different completeness and accuracy of interpretation are given as input.

Conclusions: Overall, the global meta-heuristic methods (DASA, PSO, and DE) clearly and significantly outperform the local derivative-based method (A717). Among the three meta-heuristics, differential evolution (DE) performs best in terms of the objective function, i.e., reconstructing the output, and in terms of convergence. These results hold for both real and artificial data, for all observability scenarios considered, and for all amounts of noise added to the artificial data. In sum, the meta-heuristic methods considered are suitable for estimating the parameters in the ODE model of the dynamics of endocytosis under a range of conditions: With the model and conditions being representative of parameter estimation tasks in ODE models of biochemical systems, our results clearly highlight the promise of bio-inspired meta-heuristic methods for parameter estimation in dynamic system models within system biology.


Figures

Figure 1
Figure 1
The differential ant-stigmergy algorithm (DASA). High-level block-diagram representation of the DASA method.
Figure 2
Figure 2
Simulated behavior of the Rab5-to-Rab7 conversion model. Simulation of the cut-out switch model of the conversion of Rab5 domain proteins to the Rab7 domain proteins in the regulatory system of endocytosis as proposed by Del Conte-Zerial et al. [16].
Figure 3
Figure 3
RMSE performance of the models obtained by parameter estimation from artificial data. Boxplots of the performance distributions of the four optimization methods (DASA, PSO, DE, and A717) in terms of the quality of the reconstructed output (RMSE), when considering four different observation scenarios (columns CO, AO, TO, and NPO) and three artificial datasets (rows): a) noise-free, s = 0%; b) noisy data, s = 5%; and c) noisy data, s = 20%. Due to the large differences in the order of magnitude, the RMSE values are plotted on a logarithmic scale.
Figure 4
Figure 4
RMSEm performance of the models obtained by parameter estimation from artificial data. Boxplots of the performance distributions of the four optimization methods (DASA, PSO, DE, and A717) in terms of the quality of the complete model reconstruction (RMSEm), when considering four different observation scenarios (columns CO, AO, TO, and NPO) and three artificial datasets (rows): a) noise-free, s = 0%; b) noisy data, s = 5%; and c) noisy data, s = 20%. Due to the large differences in the order of magnitude, the RMSEm values are plotted on a logarithmic scale.
Figure 5
Figure 5
Convergence performance of the optimization methods on the task of parameter estimation from artificial data. Convergence curves of the four parameter estimation methods (DASA, PSO, DE, and A717) applied to three artificial datasets (columns) and four observation scenarios (rows): a) CO; b) AO; c) TO; and d) NPO. Graphs in the left column correspond to the noise-free data set, while the graphs in the middle and right column correspond to the noisy datasets with 5% and 20% relative noise, respectively. In order to capture the convergence trend over a wide range of values, the convergence curves are plotted using logarithmic scales for both axes.
Figure 6
Figure 6
RMSE performance of the models obtained by parameter estimation from measured data. Boxplots of the performance distributions of the four optimization methods (DASA, PSO, DE, and A717) in terms of the reconstructed output (RMSE), when considering two different observability scenarios (columns TO and NPO) and three datasets: a) measured data, b) artificial data with s = 5% relative noise; and c) artificial data with s = 20% relative noise. Graphs b) and c) are the same as the corresponding graphs from Figure 3. Due to the large differences in the order of magnitude, the RMSEm values are plotted on a logarithmic scale.
Figure 7
Figure 7
Convergence performance of the optimization methods on the task of parameter estimation from measured data. Convergence curves of the four parameter estimation methods (DASA, PSO, DE, and A717) when considering two observation scenarios: a) TO and b) NPO. In order to capture the convergence trend over a wide range of values the convergence curves are plotted using logarithmic scales for both axes.
Figure 8
Figure 8
Simulated behavior of the best models obtained by parameter estimation from measured data in the TO observation scenario. Experimental (observed) vs. reconstructed output (left-hand side) and simulated behavior (right-hand side) of the model corresponding to the best parameters' values estimated from measured data in the TO observation scenario using: a) DASA and b) DE.
Figure 9
Figure 9
Correlation matrices for the parameters' estimates obtained by DE from noisy data (s = 20%) in a Monte Carlo-based approach. Colored matrix cells visualize the correlation R for parameter pairs based on a scale-to-color mapping. The cells on the main diagonal represent the self-correlations of the parameters (they are equal to 1). The most correlated pairs of parameters per observations scenarios are: a) R(c6, c16) = 0.99997, R(c1, c5) = 0.99997, R(c7, c18) = 0.9862, R(c7, c9) = 0.9093, R(c8, c9) = -0.8749, R(c9, c18) = 0.8568, R(c2, c13) = 0.8413 in the case of CO; b) R(c8, c9) = -0.9097 and R(c9, c18) = -0.7789 in the case of AO; and c) R(c6, c16) = 0.9980, R(c1, c5) = 0.9934, R(c7, c18) = 0.9901, R(r5(0), R5(0) = -0.8509, R(c2, c13) = 0.8343, and R(c8, c9) = -0.8105 in the case of TO. Smallest values for R are obtained for the following pairs of parameters: a) R(c1, c18) = -0.00196 in the case of CO; b) R(c3, c5) = 0.000032 in the case of AO; and c) R(c4, c6) = -0.0011 in the case of TO.
Figure 10
Figure 10
Contour plots of the objective function with scatter plots of the parameters' estimates obtained by DE from noisy data (s = 20%) in a Monte Carlo-based approach. The plots correspond to two representative pairs of correlated parameters in the observation scenarios: a) CO; b) AO; and c) TO. Note that one pair of correlated parameters in the TO observation scenario corresponds to the initial values of the Rab5 protein. The green dot represents the reference parameter value from Eqs. (11) and (12). The red dots are the parameters' estimates obtained by the DE method with the Monte Carlo-based approach.

References

    1. Banga JR. Optimization in computational system biology. BMC Syst Biol. 2008;2:47. doi: 10.1186/1752-0509-2-47. - DOI - PMC - PubMed
    1. Chou IC, Voit OE. Recent developments in parameter estimation and structure identification of biochemical and genomic systems. Math Biosci. 2009;219:57–83. doi: 10.1016/j.mbs.2009.03.002. - DOI - PMC - PubMed
    1. Balsa-Canto E, Banga JR. An iterative identification procedure for dynamic modeling of biochemical networks. BMC Syst Biol. 2010;4:11. doi: 10.1186/1752-0509-4-11. - DOI - PMC - PubMed
    1. Rice JA. Mathematical Statistics and Data Analysis. 3. Belmont, CA: Duxbury Press; 2007.
    1. Samaniego FJ. A Comparison of the Bayesian and Frequentist Approaches to Estimation. New York: Springer; 2010.

Publication types

LinkOut - more resources