. 2011 Nov;138(21):4609-19.
doi: 10.1242/dev.067165.

Hesr1 and Hesr3 are essential to generate undifferentiated quiescent satellite cells and to maintain satellite cell numbers

Affiliations

Hesr1 and Hesr3 are essential to generate undifferentiated quiescent satellite cells and to maintain satellite cell numbers

So-ichiro Fukada et al. Development. 2011 Nov.

Abstract

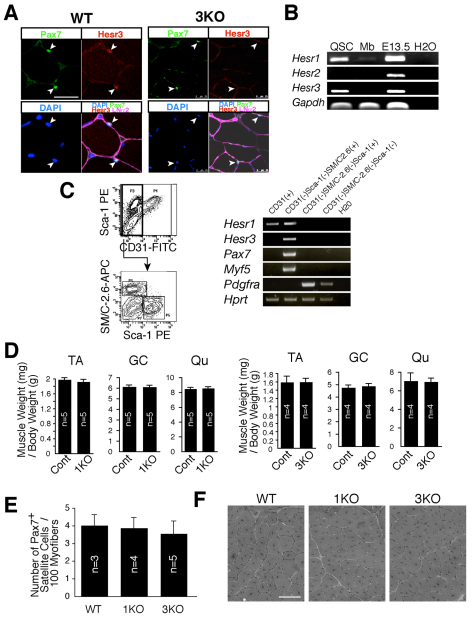
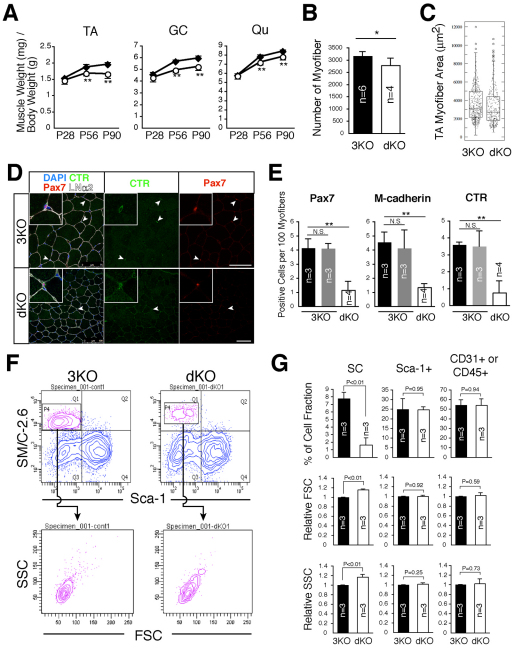
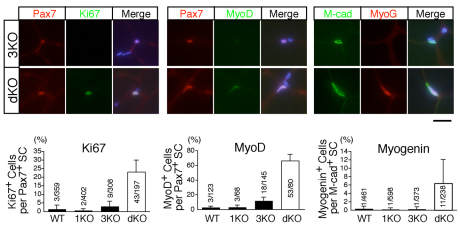
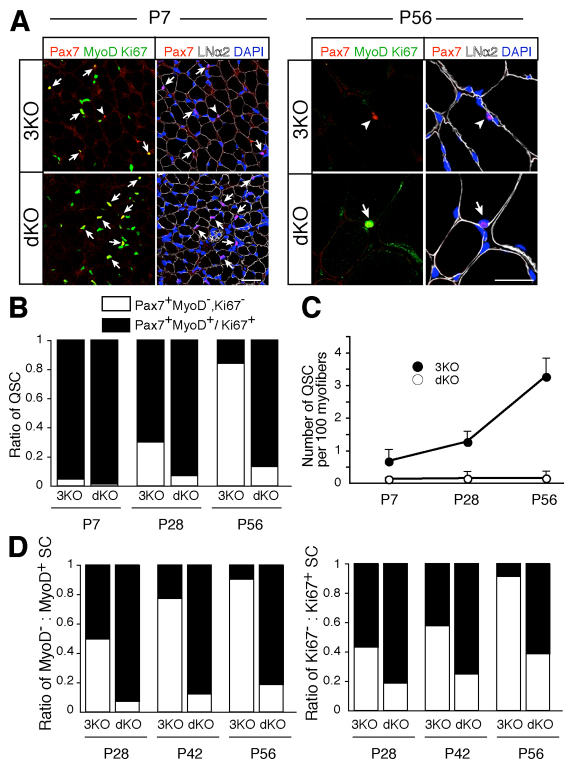
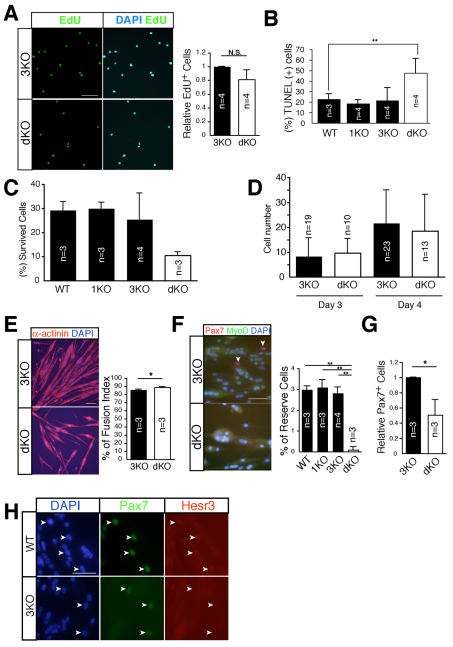
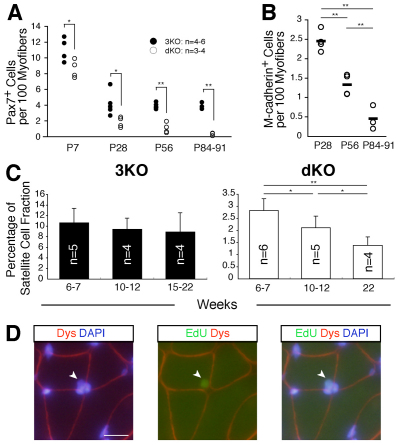
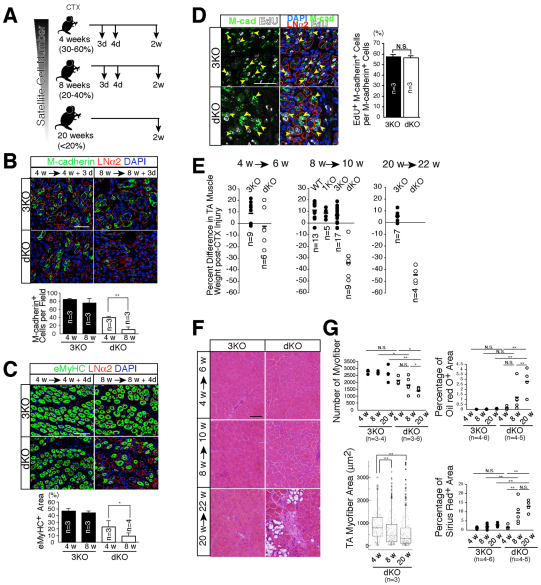
Satellite cells, which are skeletal muscle stem cells, divide to provide new myonuclei to growing muscle fibers during postnatal development, and then are maintained in an undifferentiated quiescent state in adult skeletal muscle. This state is considered to be essential for the maintenance of satellite cells, but their molecular regulation is unknown. We show that Hesr1 (Hey1) and Hesr3 (Heyl) (which are known Notch target genes) are expressed simultaneously in skeletal muscle only in satellite cells. In Hesr1 and Hesr3 single-knockout mice, no obvious abnormalities of satellite cells or muscle regenerative potentials are observed. However, the generation of undifferentiated quiescent satellite cells is impaired during postnatal development in Hesr1/3 double-knockout mice. As a result, myogenic (MyoD and myogenin) and proliferative (Ki67) proteins are expressed in adult satellite cells. Consistent with the in vivo results, Hesr1/3-null myoblasts generate very few Pax7(+) MyoD(-) undifferentiated cells in vitro. Furthermore, the satellite cell number gradually decreases in Hesr1/3 double-knockout mice even after it has stabilized in control mice, and an age-dependent regeneration defect is observed. In vivo results suggest that premature differentiation, but not cell death, is the reason for the reduced number of satellite cells in Hesr1/3 double-knockout mice. These results indicate that Hesr1 and Hesr3 are essential for the generation of adult satellite cells and for the maintenance of skeletal muscle homeostasis.


Figures

Fig. 1.
Fig. 1.
Expression of Hesr family genes and the Hesr1-null and Hesr3-null skeletal muscle phenotypes. (A) Transverse sections of tibialis anterior muscle from wild-type (WT) and Hesr3-null (3KO) mice (a negative control for anti-Hesr3 antibody) were stained with antibodies to laminin α2 (violet), Pax7 (green) and Hesr3 (red) and with DAPI (blue). Arrowheads indicate Pax7-expressing cells lying beneath the basal lamina. (B) RT-PCR of Hesr family genes in quiescent satellite cells (QSC) and myoblasts [Mb; cultured for 3 days in growth medium (GM)]. A whole E13.5 embryo and water were used as positive and negative controls, respectively. (C) RT-PCR of Hesr1 and Hesr3 in mononuclear cells derived from 10-week-old uninjured skeletal muscle. FACS profiles show each cell population used in RT-PCR. (D) Tibialis anterior (TA), gastrocnemius (GC) and quadriceps (Qu) muscle weight (mg) per gram body weight of 3-month-old male Hesr1-null (1KO), 9-month-old male 3KO and control littermate (cont) mice. The y-axis shows the mean with s.d. (E) The number of Pax7+ satellite cells in 10-week-old female uninjured TA muscle of WT, 1KO and 3KO mice. The y-axis shows the mean number of satellite cells per 100 cross-sectional myofibers with s.d. (F) A TA muscle of each 8-week-old mouse was injected with cardiotoxin and the muscles were fixed 2 weeks after the injection. The number of mice used in each study is indicated. Scale bars: 25 μm in A; 100 μm in F.
Fig. 2.
Fig. 2.
Decrease in muscle weight and satellite cell number in Hesr1/3 double-knockout (dKO) mice. (A) TA, GC and Qu muscle weight (mg) per gram body weight of 28-, 56- and 90-day-old male 3KO (black diamonds) and dKO (white circles) mice. The y-axis shows the mean with s.d. (B) The mean number of myofibers in uninjured TA muscle of 8-week-old male 3KO and dKO mice. The y-axis shows the mean number of myofibers per section with s.d. (C) The area of myofibers in B. (D) Transverse sections were stained for laminin α2 (white), Pax7 (red), calcitonin receptor (CTR, green) and with DAPI (blue). Arrowheads indicate Pax7-expressing cells lying beneath the basal lamina. Scale bar: 75 μm. (E) Satellite cell marker-positive cells in uninjured TA muscle of 8-week-old male dKO mice and 3KO littermates (black bar, Hesr1+/+Hesr3–/–; gray bar, Hesr1+/–Hesr3–/–). The y-axis shows the mean number of satellite cells per 100 cross-sectional myofibers with s.d. (F) FACS profiles of mononuclear cells derived from 13-week-old male 3KO or dKO muscles. The upper profiles were gated for CD31 CD45 fractions. The lower profiles show the cell size (FSC) and cell granularity (SSC) of satellite cell fractions (SM/C-2.6+ CD31 CD45 Sca1). (G) The mean frequency, relative FSC and relative SSC of derived cell populations: satellite cells, CD31 CD45 Sca1+; and endothelial cells or hematopoietic cells, CD31+ or CD45+. Thirteen- to 15-week-old mice were used. The number of mice used in each study is shown. *, P<0.05; **, P<0.01. N.S., non-significant difference.
Fig. 3.
Fig. 3.
Myogenic and proliferative marker expression in adult dKO satellite cells. Uninjured TA muscles of 10-week-old female dKO and 3KO mice were stained with Ki67 (green), MyoD (green) and myogenin (red) antibodies. Pax7 (red) and M-cadherin (green) antibodies were used to detect satellite cells. Scale bar: 20 μm. The graphs beneath indicate the frequency of each marker-positive cell in WT, 1KO, 3KO and dKO mice. The y-axis shows the mean value with s.d. (n=3-5). The number of marker-positive satellite cells among total counted satellite cells is indicated in each bar.
Fig. 4.
Fig. 4.
Failure of dKO satellite cells to enter the undifferentiated quiescent state. (A) Quantitative analysis of undifferentiated quiescent satellite cells in uninjured TA muscle at P7 and P56. Arrows and arrowheads indicate differentiated non-quiescent (Pax7+, Ki67+/MyoD+) and undifferentiated quiescent (Pax7+, Ki67, MyoD) satellite cells, respectively. Pax7, red; MyoD/Ki67, green; laminin α2, white; DAPI, blue. Scale bars: 25 μm. (B) Ratio of undifferentiated quiescent (white) to differentiated non-quiescent (black) satellite cells in uninjured TA muscle of dKO and littermate 3KO mice at the indicated ages. The value shown is an average of the results of experiments conducted with three to four mice. (C) The number of undifferentiated quiescent satellite cells in B. The y-axis shows the mean number of satellite cells per 100 cross-sectional myofibers with s.d. (D) Relative ratio of MyoD (white) to MyoD+ satellite cells (black) and Ki67 (white) versus Ki67+ satellite cells (black). The value shown is an average of the results of experiments conducted with three mice. The x-axis indicates the age of the mice analyzed.
Fig. 5.
Fig. 5.
Hesr1 and Hesr3 influence the generation of reserve cells. (A) EdU (green) uptake of primary myoblasts derived from dKO or littermate 3KO mice. Nuclei were stained with DAPI (blue). The y-axis shows the mean value with s.d. (n=4). (B) Freshly isolated satellite cells were cultured in GM for 24 hours and then TUNEL staining was performed. The y-axis shows the mean value of TUNEL+ cells with s.d. (n=3-4). (C) Clonal analysis of satellite cells derived from WT, 1KO, 3KO and dKO mice, showing the frequency of colony-forming cells after 7 days in culture. (D) Cell number in colonies derived from single satellite cells cultured for 3 or 4 days. Colony number is shown in each bar. (E) Fusion index of primary myoblasts derived from dKO and littermate 3KO mice. Myotubes were stained with anti-sarcomeric α-actinin antibody (red) and DAPI (blue). The bar chart shows the mean percentage of the fusion index with s.d. (n=3). (F) Reserve cell frequencies of primary myoblasts derived from WT, 1KO, 3KO and dKO mice. The cells were stained with anti-Pax7 (red), anti-MyoD (green) and with DAPI (blue). Arrowheads indicate Pax7+ MyoD mononuclear reserve cells. The bar chart shows the mean percentage of reserve cells with s.d. (n=3-4). (G) Relative number of Pax7-expressing cells derived from 3KO and dKO mice in differentiation medium (DM) for 1.5-2 days. The y-axis shows the mean value with s.d. (n=3). Six- to 13-week-old mice were used in these experiments. (H) The cells were cultured in DM for 3 days and stained with anti-Pax7 (green), anti-Hesr3 (red) and DAPI (blue). Arrowheads indicate Pax7+ mononuclear cells. *, P<0.05; **, P<0.01. Scale bars: 100 μm in E; 50 μm in A,F,H.
Fig. 6.
Fig. 6.
The number of dKO satellite cells gradually decreases with age. (A,B) The y-axis indicates the number of Pax7+ (A) or M-cadherin+ (B) cells per 100 cross-sectional TA myofibers in dKO (white circles) and 3KO (black circles) mice. The x-axis indicates the age of the analyzed mice. (C) Quantitative analyses of satellite cell number by flow cytometry. The y-axis shows the percentage of SM/C-2.6+ CD31 CD45 Sca1 (satellite) cells in dKO and 3KO 6- to 22-week-old mice. Error bars indicate s.d. The number of mice used in each study is shown. (D) Immunostaining of EdU (green) and dystrophin (Dys, red) and DAPI staining (blue) in dKO TA muscle. EdU+ myofiber nuclei (arrowhead) were detected in dKO TA muscle. *, P<0.05; **, P<0.01. Scale bar: 20 μm.
Fig. 7.
Fig. 7.
Age-dependent regeneration defect in dKO mice. (A) Cardiotoxin (CTX) time scheme for analysis of the regenerative potential of each age group. The percentage value indicates the estimated frequency of dKO satellite cells compared with that of 3KO mice. (B) Immunostaining of M-cadherin (green) and laminin α2 (red) and DAPI staining (blue) in injured muscle 3 days after CTX injection. The y-axis shows the number of M-cadherin+ cells per field in dKO or littermate 3KO mice. Error bars indicate the mean with s.d. (C) Immunostaining of embryonic myosin heavy chain (eMyHC, green) and laminin α2 (red) and DAPI staining (blue) in injured muscle 4 days after CTX injection. The y-axis shows the eMyHC+ area (percentage) in dKO or littermate 3KO mice. Error bar indicates the mean with s.d. (D) In vivo EdU (white) uptake of M-cadherin+ cells (green) in injured muscle 3 days after CTX injection of dKO or littermate 3KO mice. Red indicates laminin α2 expression. Nuclei were stained with DAPI (blue). Arrowheads indicate EdU+ M-cadherin+ cells. The y-axis shows the mean percentage of EdU+ cells in M-cadherin+ cells with s.d. (E) The change in TA muscle weight after regeneration. Each circle (WT, 1KO and 3KO, black; dKO, white) indicates the result of one mouse. Bar indicates the mean value of each group. (F) TA muscles of 3KO and dKO mice were examined histologically 2 weeks after CTX injection. Transverse sections were stained with H&E. (G) Quantitative analyses of the number and area of myofibers, the Oil Red O+ area and the Sirius Red+ area in injured muscles. Each circle (3KO, black; dKO, white) indicates the result of one mouse. Bar indicates the mean value of each group. *, P<0.05; **, P<0.01; N.S., non-significant difference. Scale bars: 25 μm in B; 50 μm in C,D,F.

References

    1. Asakura A., Hirai H., Kablar B., Morita S., Ishibashi J., Piras B. A., Christ A. J., Verma M., Vineretsky K. A., Rudnicki M. A. (2007). Increased survival of muscle stem cells lacking the MyoD gene after transplantation into regenerating skeletal muscle. Proc. Natl. Acad. Sci. USA 104, 16552-16557 - PMC - PubMed
    1. Beauchamp J. R., Heslop L., Yu D. S., Tajbakhsh S., Kelly R. G., Wernig A., Buckingham M. E., Partridge T. A., Zammit P. S. (2000). Expression of CD34 and Myf5 defines the majority of quiescent adult skeletal muscle satellite cells. J. Cell Biol. 151, 1221-1234 - PMC - PubMed
    1. Buas M. F., Kabak S., Kadesch T. (2009). Inhibition of myogenesis by Notch: evidence for multiple pathways. J. Cell. Physiol. 218, 84-93 - PMC - PubMed
    1. Charge S. B., Rudnicki M. A. (2004). Cellular and molecular regulation of muscle regeneration. Physiol. Rev. 84, 209-238 - PubMed
    1. Conboy I. M., Conboy M. J., Smythe G. M., Rando T. A. (2003). Notch-mediated restoration of regenerative potential to aged muscle. Science 302, 1575-1577 - PubMed

Publication types

MeSH terms