. 2011 Nov;138(21):4709-19.
doi: 10.1242/dev.067710.

Analysis of gene networks in white adipose tissue development reveals a role for ETS2 in adipogenesis

Affiliations

Analysis of gene networks in white adipose tissue development reveals a role for ETS2 in adipogenesis

Kivanç Birsoy et al. Development. 2011 Nov.

Abstract

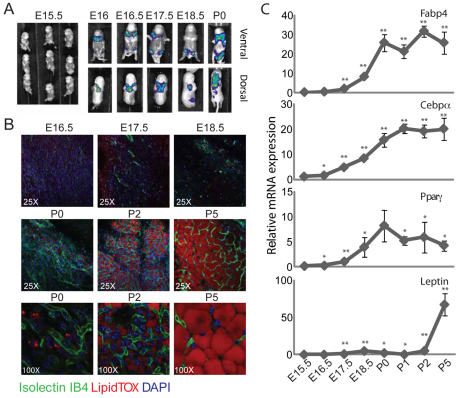
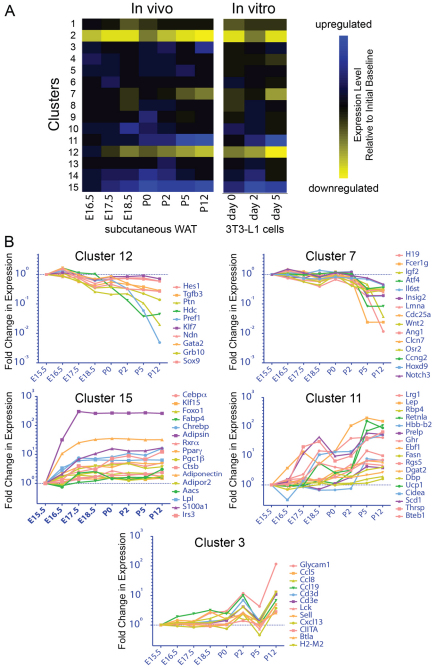
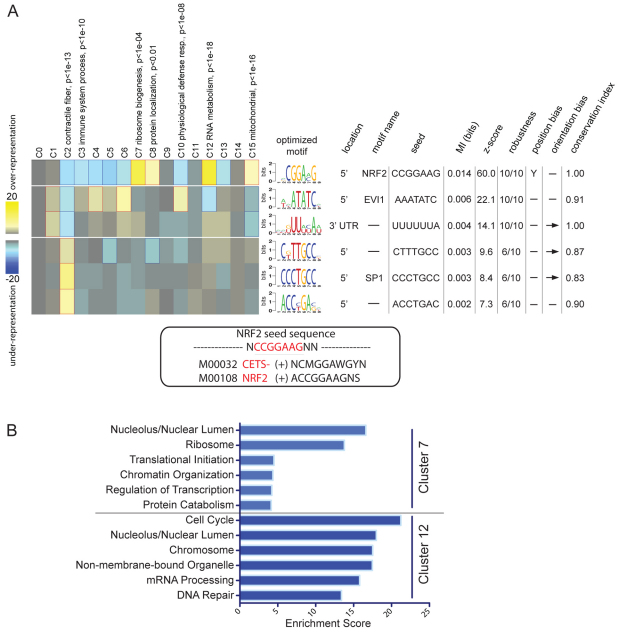
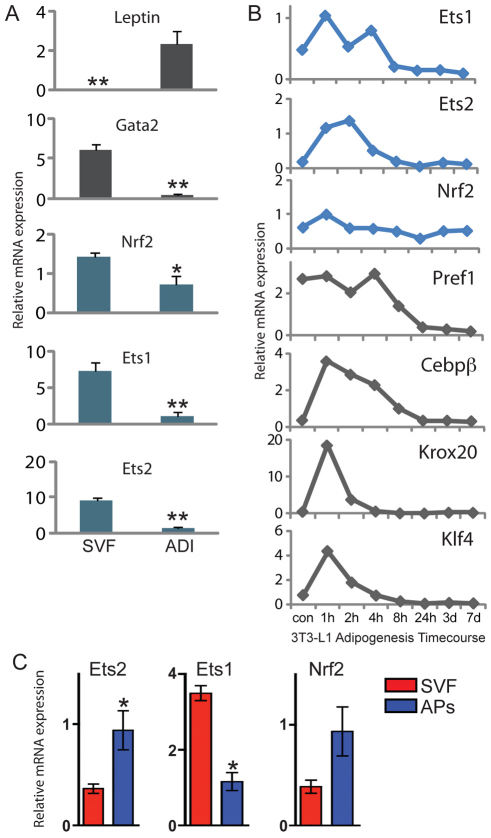
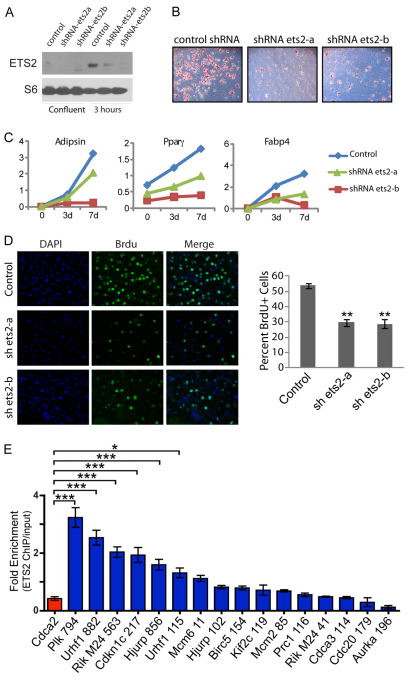
Obesity is characterized by an expansion of white adipose tissue mass that results from an increase in the size and the number of adipocytes. However, the mechanisms responsible for the formation of adipocytes during development and the molecular mechanisms regulating their increase and maintenance in adulthood are poorly understood. Here, we report the use of leptin-luciferase BAC transgenic mice to track white adipose tissue (WAT) development and guide the isolation and molecular characterization of adipocytes during development using DNA microarrays. These data reveal distinct transcriptional programs that are regulated during murine WAT development in vivo. By using a de novo cis-regulatory motif discovery tool (FIRE), we identify two early gene clusters whose promoters show significant enrichment for NRF2/ETS transcription factor binding sites. We further demonstrate that Ets transcription factors, but not Nrf2, are regulated during early adipogenesis and that Ets2 is essential for the normal progression of the adipocyte differentiation program in vitro. These data identify ETS2 as a functionally important transcription factor in adipogenesis and its possible role in regulating adipose tissue mass in adults can now be tested. Our approach also provides the basis for elucidating the function of other gene networks during WAT development in vivo. Finally these data confirm that although gene expression during adipogenesis in vitro recapitulates many of the patterns of gene expression in vivo, there are additional developmental transitions in pre and post-natal adipose tissue that are not evident in cell culture systems.


Figures

Fig. 1.
Fig. 1.
Characterization of white adipose tissue development. (A) Bioluminescent imaging of leptin-luciferase transgenic mice at indicated embryonic developmental time points. Luciferase signal was detected using IVIS illumina imager. (B) Whole-mount confocal imaging of posterior subcutaneous white adipose tissue. Adipose tissue fragments were stained for lipidTOX (red/neutral lipids) and the endothelial marker isolectin GSIB4 (green/vasculature). (C) Real-time PCR analysis of developing posterior subcutaneous adipose tissue for adipocyte markers Fabp4, Pparg, Cebpα and leptin. Error bars indicate s.e.m. **P<0.01, *P<0.05 (compared with E15.5).
Fig. 2.
Fig. 2.
Gene expression analysis of developmental adipogenesis in vivo and comparison to adipogenesis in 3T3L1 cells. (A) k-means cluster analysis of genes during in vivo adipocyte development. (Left) All genes are grouped into 15 clusters based on expression profiles across 8 time points. Fold change relative to E15.5 is shown using a heatmap as indicated on the far right. (Right) In vivo clusters are compared with a publicly available microarray dataset in which confluent 3T3-L1 cells were induced to differentiate into adipocytes in culture. Log2 expression fold change compared with initial baseline values (E15.5 and day 2 in vivo and in vitro, respectively) was calculated for all genes for all subsequent time points and averaged across all genes in a cluster. Heatmaps were generated by limma Bioconductor package. (B) Fold change relative to E15.5 RNA expression levels is shown for selected genes in clusters 3, 7, 11, 12 and 15 during the WAT development time course.
Fig. 3.
Fig. 3.
Identification of potential regulatory sequences and functional annotation of genes within WAT clusters. (A) Identification of potential cis-regulatory elements in WAT development. FIRE analysis discovered over-represented patterns of cis-regulatory elements for specific in vivo gene clusters. Rows correspond to the discovered motifs by FIRE analysis. Columns represent the 15 clusters that were determined by k-means clustering (Fig. 2A). At the top of specific clusters is the pathway determined to be over-represented by iPAGE. For each discovered motif, location, statistical significance, score, conservation index, sequence and name of the putative known motif is shown. (Below) TFBIND analysis of the highest scoring motif (NRF2) reveals ETS and NRF2 as the candidate transcription factors binding to this motif. Transcription factor binding site for each transcription factor is indicated. (B) Gene Ontology categories over-represented in clusters 7 and 12. Functionally enriched annotation groupings within the cluster 7 and 12 gene sets were identified and assigned a statistical enrichment score using NIAID/NIH DAVID.
Fig. 4.
Fig. 4.
Expression analysis of Ets and Nrf2 transcription factors. (A) Real-time PCR expression analysis of Ets1, Ets2 and Nrf2 in stromavascular and adipocyte fractions from posterior white adipose tissue. Leptin and Gata2 levels were used as controls for purity of adipocyte and stromavascular fractions, respectively. Error bars indicate s.e.m. **P<0.01, *P<0.05. (B) Real-time PCR analysis of Ets1, Ets2 and Nrf2 during differentiation of 3T3-L1 cells. Cells were harvested at the indicated times for analysis. Cyclophilin was used as an internal control for Taqman analysis. Transcript levels for early genes Pref1, Cebpb, Klf4 and Krox20 are shown for comparison. (C) Real-time PCR analysis of Ets1, Ets2 and Nrf2 in adipocyte progenitors. RNA was isolated from FACS sorted CD45:CD31:CD29+:CD34+:Sca1+:CD24+ adipocyte progenitors and SVF singlet cells that were collected from the sorter. Tbk1, a gene that is similarly expressed in SVF and all isolated adipogenic cell populations, as determined via global gene expression analysis, was used as an internal control for qPCR. Error bars represent s.e.m. *P<0.05.
Fig. 5.
Fig. 5.
Ets2 knockdown impairs adipogenesis through an effect on clonal expansion. 3T3-L1 cells were infected with lentivirus containing shRNAs targeted to either Ets2 or control. (A) ETS2 levels were determined in control and knockdown cells by immunoblotting protein from untreated confluent cells and 3 hours after induction with the differentiation cocktail. S6 antibody is used as a loading control. (B) Oil red O staining of Ets2 knockdowns and control at day 7. (C) Expression levels of adipocyte markers Fabp4, Pparg and adipsin at confluence (0), 3 days (3d) and 7 days (7d) after differentiation. (D) Effect of Ets2 knockdown on clonal expansion. At 16-18 hours after induction of differentiation, cells were pulsed with BrdU and immediately fixed with 70% ethanol. Cells were then stained with a BrdU antibody and DAPI and photographed with a fluorescence microscope. BrdU-positive cells were then counted and percentage of BrdU-positive cells in the total cell population are shown in the graph. Error bars represent s.e.m. (n=5). **P<0.01. (E) ETS2 chromatin immunoprecipitation from 3T3-L1 cells. ETS2 ChIP was performed on confluent 3T3-L1 cells. Enrichment of predicted NRF2 promoter elements from GO cell cycle genes from cluster 12 (blue bars) was determined and compared with Cdca2, a cluster 12 GO cell cycle gene without a predicted NRF2 promoter (red bar). The genes interrogated are indicated below the graph. Numbers indicate position of putative NRF motif relative to transcription start site. Rik M24 indicates Riken 6720463M24. Error bars represent s.e.m. ***P<0.001, *P<0.05.

References

    1. Barak Y., Nelson M. C., Ong E. S., Jones Y. Z., Ruiz-Lozano P., Chien K. R., Koder A., Evans R. M. (1999). PPAR gamma is required for placental, cardiac, and adipose tissue development. Mol. Cell 4, 585-595 - PubMed
    1. Birkenmeier E. H., Gwynn B., Howard S., Jerry J., Gordon J. I., Landschulz W. H., McKnight S. L. (1989). Tissue-specific expression, developmental regulation, and genetic mapping of the gene encoding CCAAT/enhancer binding protein. Genes Dev. 3, 1146-1156 - PubMed
    1. Birsoy K., Soukas A., Torrens J., Ceccarini G., Montez J., Maffei M., Cohen P., Fayzikhodjaeva G., Viale A., Socci N. D., et al. (2008). Cellular program controlling the recovery of adipose tissue mass: An in vivo imaging approach. Proc. Natl. Acad. Sci. USA 105, 12985-12990 - PMC - PubMed
    1. Bluher M., Michael M. D., Peroni O. D., Ueki K., Carter N., Kahn B. B., Kahn C. R. (2002). Adipose tissue selective insulin receptor knockout protects against obesity and obesity-related glucose intolerance. Dev. Cell 3, 25-38 - PubMed
    1. Chen Z., Torrens J. I., Anand A., Spiegelman B. M., Friedman J. M. (2005). Krox20 stimulates adipogenesis via C/EBPbeta-dependent and -independent mechanisms. Cell Metab. 1, 93-106 - PubMed

Publication types

MeSH terms