. 2011 Nov;79(11):3025-36.
doi: 10.1002/prot.23118.

A genetically encoded, high-signal-to-noise maltose sensor

Affiliations
Free PMC article

A genetically encoded, high-signal-to-noise maltose sensor

Jonathan S Marvin et al. Proteins. 2011 Nov.
Free PMC article

Abstract

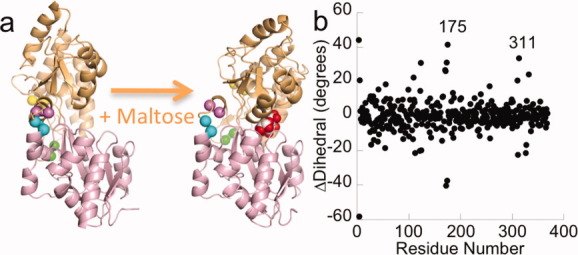
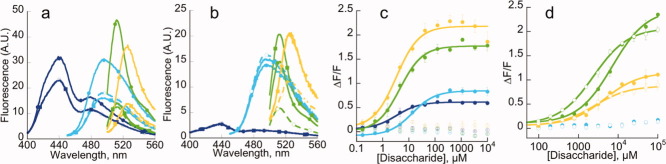
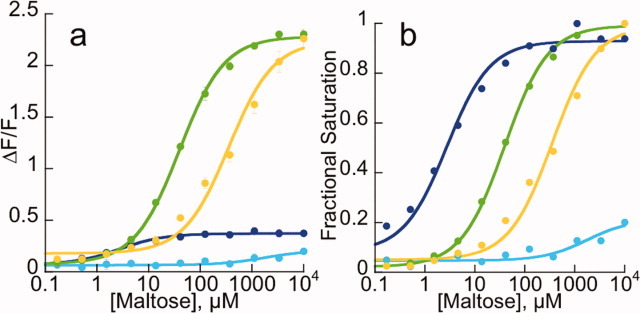
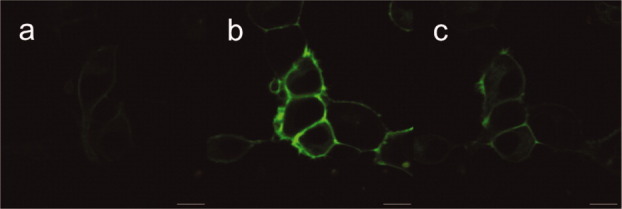
We describe the generation of a family of high-signal-to-noise single-wavelength genetically encoded indicators for maltose. This was achieved by insertion of circularly permuted fluorescent proteins into a bacterial periplasmic binding protein (PBP), Escherichia coli maltodextrin-binding protein, resulting in a four-color family of maltose indicators. The sensors were iteratively optimized to have sufficient brightness and maltose-dependent fluorescence increases for imaging, under both one- and two-photon illumination. We demonstrate that maltose affinity of the sensors can be tuned in a fashion largely independent of the fluorescent readout mechanism. Using literature mutations, the binding specificity could be altered to moderate sucrose preference, but with a significant loss of affinity. We use the soluble sensors in individual E. coli bacteria to observe rapid maltose transport across the plasma membrane, and membrane fusion versions of the sensors on mammalian cells to visualize the addition of maltose to extracellular media. The PBP superfamily includes scaffolds specific for a number of analytes whose visualization would be critical to the reverse engineering of complex systems such as neural networks, biosynthetic pathways, and signal transduction cascades. We expect the methodology outlined here to be useful in the development of indicators for many such analytes.


Figures

Figure 1
Figure 1
Conformational changes in MBP upon maltose binding. Cartoon representation (a). The residues between which cpGFP was inserted are identified with colored spheres at the Cα positions. Yellow: 165–166, green: 175–176, cyan: 311–312, and violet: 317–318. Figure was made with PyMOL. Analysis of backbone structural changes (b). The Cα dihedral is calculated from the four atoms: Cαi+2, Cαi+1, Cαi, Cαi−1. ΔDihedral is calculated as the difference in dihedrals between the closed (1ANF) and open (1OMP) states of MBP and corrected to fall within a range of −180° to 180°. The regions near residues 175 and 311 are labeled. There is a crystallographic artifact at the N-terminus resulting in the appearance of significant structural changes.
Figure 2
Figure 2
Fluorescence emission spectra of the MBP165-blue, cyan, green, and yellow wild-type sensors (a) and the 5-7 variants (b) in the absence of ligand (dashed lines, open circles), with 10 mM maltose (solid lines, filled circles) or 10 mM sucrose (solid lines, filed squares). Sensors were excited at 383, 433, 485, and 485 nm, respectively. Titration of maltose and sucrose in the blue, cyan, green, and yellow MBP165 wild-type sensors (c) and for the 5-7 variants (d). Filled circles are titration of maltose, and open circles are titration of sucrose. For the wild-type sensors, Kds for maltose binding are as follows: blue 3.3 μM, cyan 13 μM, green 4.5 μM, and yellow 3.3 μM. No sucrose binding is observed. For the 5-7 variants, Kd of green is 2.4 mM (sucrose) and 7.1 mM (maltose). Kd of yellow is 2.5 mM (sucrose) and 4.5 mM (maltose). The fluorescence and signal-to-noise ratio of the cyan and blue 5-7 variants are so low that it is not possible to accurately determine ΔF/F.
Figure 3
Figure 3
Four-colored composite maltose sensor. The four-colored maltose sensors, with appropriate mutations to the maltose-binding site, were combined in one solution to detect changes in maltose concentration from less than 1 μM to greater than 1 mM. Blue (wt-binding pocket) has an affinity of 2.7 μM. Green (W230A) has an affinity of 40 μM. Yellow (W62A) has an affinity of 350 μM. Cyan (W340A) has an affinity of ∼1.7 mM. Data are plotted at ΔF/F (a) or normalized to fractional saturation (b).
Figure 4
Figure 4
Images of individual HEK293 cells expressing membrane-displayed PPYF.T203V in the absence of maltose (a), in the presence of 1 mM maltose (b), and after washout with maltose-free buffer (c). Scale bars are 10 μm.
Figure 5
Figure 5
Cartoon representation and close-up views of interdomain linkers and selected amino acids of the cpGFP chromophore environment of the structure of MBP175-cpGFP.L1-HL (a, b) and MBP311-cpGFP.L2-NP (c, d) bound to maltose. The MBP domain is colored as in Figure 1(a). The cpGFP domain is green, and the interdomain linkers are colored white. The cpGFP chromophore is displayed as sticks and the bound maltose as red and white spheres. Ordered water molecules are represented as red spheres. Selected hydrogen bonds are displayed as dashed black lines. β-Strands 10 and 11 of cpGFP are displayed as semitransparent for clarity. The 2FoFc electron density map calculated with the displayed residues omitted from the model is shown as blue mesh.

References

    1. Frommer WB, Davidson MW, Campbell RE. Genetically encoded biosensors based on engineered fluorescent proteins. Chem Soc Rev. 2009;38:2833–2841. - PMC - PubMed
    1. Okumoto S. Imaging approach for monitoring cellular metabolites and ions using genetically encoded biosensors. Curr Opin Biotechnol. 2010;21:45–54. - PMC - PubMed
    1. Miesenbock G, De Angelis DA, Rothman JE. Visualizing secretion and synaptic transmission with pH-sensitive green fluorescent proteins. Nature. 1998;394:192–195. - PubMed
    1. Jayaraman S, Haggie P, Wachter RM, Remington SJ, Verkman AS. Mechanism and cellular applications of a green fluorescent protein-based halide sensor. J Biol Chem. 2000;275:6047–6050. - PubMed
    1. Dooley CT, Dore TM, Hanson GT, Jackson WC, Remington SJ, Tsien RY. Imaging dynamic redox changes in mammalian cells with green fluorescent protein indicators. J Biol Chem. 2004;279:22284–22293. - PubMed

Publication types

MeSH terms

Substances