. 2011 Nov 25;286(47):40584-94.
doi: 10.1074/jbc.M111.232918. Epub 2011 Oct 11.

Inhibition of gluconeogenic genes by calcium-regulated heat-stable protein 1 via repression of peroxisome proliferator-activated receptor α

Affiliations

Inhibition of gluconeogenic genes by calcium-regulated heat-stable protein 1 via repression of peroxisome proliferator-activated receptor α

Yanbo Fan et al. J Biol Chem. .

Abstract

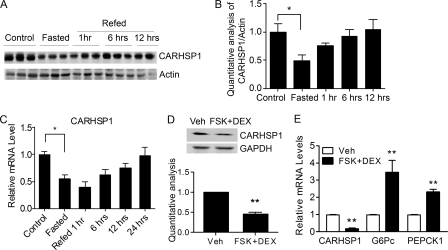
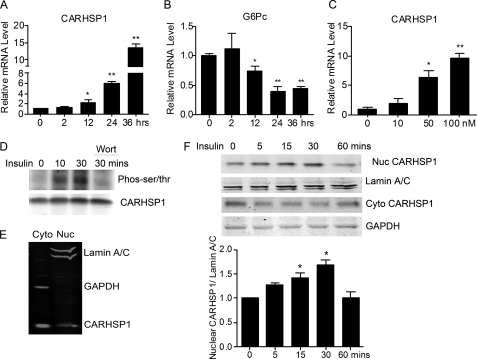
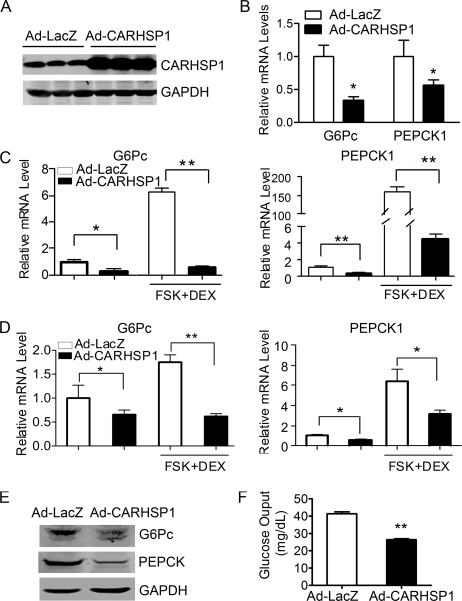
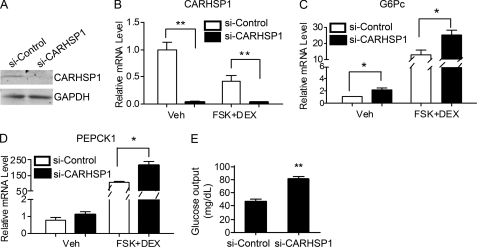
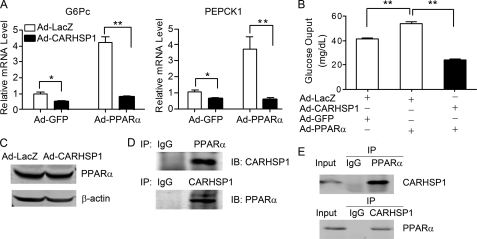
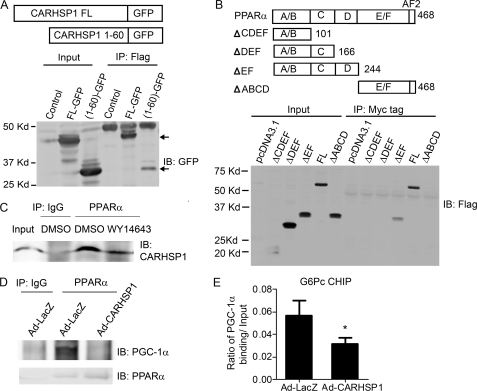
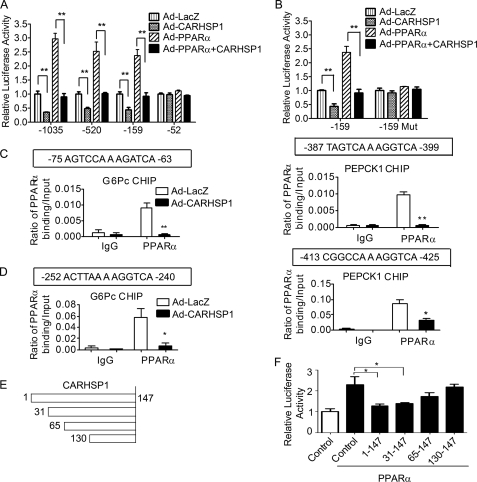
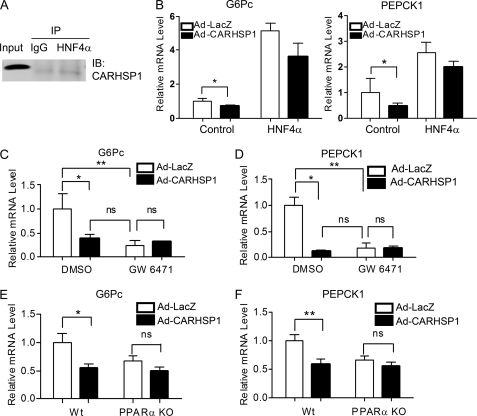
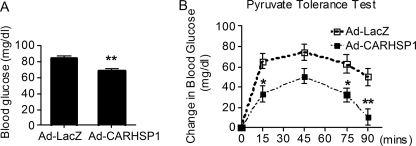
Gluconeogenesis contributes to insulin resistance in type 1 and type 2 diabetes, but its regulation and the underlying molecular mechanisms remain unclear. Recently, calcium-regulated heat-stable protein 1 (CARHSP1) was identified as a biomarker for diabetic complications. In this study, we investigated the role of CARHSP1 in hepatic gluconeogenesis. We assessed the regulation of hepatic CARHSP1 expression under conditions of fasting and refeeding. Adenovirus-mediated CARHSP1 overexpression and siRNA-mediated knockdown experiments were performed to characterize the role of CARHSP1 in the regulation of gluconeogenic gene expression. Here, we document for the first time that CARHSP1 is regulated by nutrient status in the liver and functions at the transcriptional level to negatively regulate gluconeogenic genes, including the glucose-6-phosphatase catalytic subunit (G6Pc) and phosphoenolpyruvate carboxykinase 1 (PEPCK1). In addition, we found that CARHSP1 can physically interact with peroxisome proliferator-activated receptor-α (PPARα) and inhibit its transcriptional activity. Both pharmacological and genetic ablations of PPARα attenuate the inhibitory effect of CARHSP1 on gluconeogenic gene expression in hepatocytes. Our data suggest that CARHSP1 inhibits hepatic gluconeogenic gene expression via repression of PPARα and that CARHSP1 may be a molecular target for the treatment of diabetes.


Figures

FIGURE 1.
FIGURE 1.
CARHSP1 is regulated by physiological and pathophysiological stimuli. C57BL/6J mice were fasted for 24 h and then refed for the indicated times (n = 3). Liver protein expression levels were determined by Western blotting (A) and quantitatively analyzed and normalized against the internal control (B). C, C57BL/6J mice were fasted for 24 h and then refed at different time points. CARHSP1 expression in the liver was determined by real-time PCR. D and E, primary mouse hepatocytes were treated with 1 μm DEX and 10 μm forskolin (FSK) in 0.2% FBS medium for 16 h, and then protein and mRNA levels were determined by Western blotting (D) and real-time PCR (E). Quantitative analysis in D and E is from three independent experiments. Data are presented as mean ± S.E. *, p < 0.05; **, p < 0.01. Veh, vehicle.
FIGURE 2.
FIGURE 2.
Subcellular distribution of CARHSP1 in hepatocytes. A, primary mouse hepatocytes were treated with insulin (50 nm) in 2% FBS DMEM and the expression levels of CARHSP1 (A) and of G6Pc (B) were determined by real-time PCR at different time points. C, primary mouse hepatocytes were treated with insulin at different dosages for 24 h, and the expression of CARHSP1was determined by real-time PCR. D, HepG2 cells were incubated with insulin (50 nm) for the indicated times. Cells treated with insulin for 30 min were pretreated with wortmannin (200 nm). Cell extracts were subjected to coimmunoprecipitation with an antibody against CARHSP1 and then immunoblotting with an antibody against phosphorylated Ser/Thr (pan). E, cytoplasmic and nuclear aliquots (20 μg loaded protein) were purified from HepG2 cells and subjected to immunoblotting analysis. F, primary mouse hepatocytes were treated with insulin (50 nm) for different times. Cytoplasmic and nuclear protein were extracted and subjected to immunoblotting analysis. Nuclear CARHSP1 is quantitatively analyzed and normalized against Lamin A/C. Data are presented as mean ± S.E. *, p < 0.05; **p < 0.01.
FIGURE 3.
FIGURE 3.
Adenovirus-mediated overexpression of CARHSP1 inhibits gluconeogenic genes in hepatocytes. C57BL/6J mice were injected with Ad-CARHSP1 or Ad-LacZ (2 × 10⁹ virus particles) by the tail vein, n = 4–5. Four days later, the expression of CARHSP1 was detected by Western blotting (A), and the mRNA expression levels of gluconeogenic genes G6Pc and PEPCK1 were determined by real-time PCR (B). C, primary mouse hepatocytes were infected with Ad-CARHSP1 or Ad-LacZ (100 m.o.i.) for 24 h in 10% FBS DMEM and then maintained in 0.2% FBS DMEM for 24 h, followed by stimulation with dexamethasone (1 μm) and forskolin (FSK) (10 μm) for 1.5 h. G6Pc and PEPCK1 mRNA expression levels were detected by real-time PCR. D, 48 h post-infection with Ad-CARHSP1 or Ad-LacZ, HepG2 cells were cultured in 0.2% FBS DMEM for 5 h, then stimulated with dexamethasone (1 μm) and forskolin (10 μm) for 1.5 h. PEPCK1 and G6Pc mRNA expression levels were detected by real-time PCR. E and F, primary mouse hepatocytes were infected with Ad-CARHSP1 or Ad-LacZ (100 m.o.i.) in 10% FBS DMEM for 24 h and then maintained in 0.2% FBS DMEM for another 24 h. The protein expression levels of G6Pc and PEPCK1 were detected by Western blotting (E). Glucose output assays were performed in primary mouse hepatocytes (F). Data in C, D, and F are from three independent experiments and presented as mean ± S.E. *, p < 0.05; **, p < 0.01.
FIGURE 4.
FIGURE 4.
Effect of CARHSP1 knockdown on the expression of gluconeogenic genes. A, CARHSP1 protein levels were efficiently knocked down by transfection of siRNA against CARHSP1 (40 nm) for 48 h in primary mouse hepatocytes as determined by Western blotting. B, CARHSP1 was knocked down in primary mouse hepatocytes by transfection of siRNA against CARHSP1 (40 nm). After 48 h, cells were stimulated with dexamethasone (1 μm) and forskolin (FSK) (10 μm) for 1.5 h. The mRNA levels of CARHSP1 (B), G6Pc (C), and PEPCK1 (D) were detected by real-time PCR. E, glucose output assays were performed to detect the effect of CARHSP1 knockdown on glucose output in primary mouse hepatocytes. The data shown are from three independent experiments and presented as mean ± S.E. *, p < 0.05; **, p < 0.01.
FIGURE 5.
FIGURE 5.
CARHSP1 inhibits PPARα-induced gluconeogenic gene expression in hepatocytes. A, HepG2 cells were coinfected with Ad-CARHSP1 or Ad-LacZ in the presence or absence of Ad-PPARα and Ad-GFP (50 m.o.i./each adenovirus) in 10% FBS medium, and after 48 h G6Pc and PEPCK1 mRNA expression levels were detected by real-time PCR. B, primary mouse hepatocytes were infected with Ad-CARHSP1 or Ad-LacZ (50 m.o.i./each adenovirus) in the presence or absence of Ad-PPARα and Ad-GFP for 24 h in 10% FBS DMEM and then maintained in 0.2% FBS DMEM for another 24 h when the glucose output assays were performed. Data shown are from three independent experiments and presented as mean ± S.E. *, p < 0.05; **, p < 0.01. C, HepG2 cells were infected with Ad-LacZ or Ad-CARHSP1 (50 m.o.i.). After 24 h, protein levels of PPARα were detected by Western blotting. D, coimmunoprecipitation was performed with an antibody against PPARα or CARHSP1 in mouse liver. Normal IgG was used as a negative control. E, HepG2 cells were infected with Ad-PPARα (100 m.o.i.) 24 h before coimmunoprecipitation with an antibody against PPARα or CARHSP1. Normal rabbit IgG was used as a negative control.
FIGURE 6.
FIGURE 6.
CARHSP1 interacts with PPARα. A, either full-length CARHSP1-GFP or the 1–60 amino acid sequence of the CARHSP1-GFP fusion protein was cotransfected with FLAG-PPARα into HepG2 cells for 24 h before coimmunoprecipitation with an antibody against FLAG and then immunoblotting with an antibody against GFP. B, FLAG-PPARα fragments and Myc-tagged CARHSP1 were cotransfected into HepG2 cells for 24 h before coimmunoprecipitation with an antibody against Myc-tag and then by immunoblotting (IB) with an antibody against FLAG. C, Primary mouse hepatocytes were treated with WY-14643 (50 μm) for 40 min and then subjected to immunoprecipitation with an antibody against PPARα. Normal rabbit IgG was used as a negative control. D, HepG2 cells were infected with Ad-CARHSP1 or Ad-LacZ 24 h before coimmunoprecipitation with an antibody against PPARα and then subjected to immunoprecipitation with an antibody against PGC1α or PPARα. E, C57BL/6J mice were injected with Ad-CARHSP1 or Ad-LacZ (2 × 10⁹ virus particles) by tail vein. After 4 days, liver samples were isolated, and then CHIP assays were performed using antibodies against PGC-1α and normal rabbit IgG. Purified DNA fragments were detected by real-time PCR. The primers for the ChIP assays were designed to detect the DNA sequence containing putative PPREs in the promoter of G6Pc. Data shown are presented as mean ± S.E. *, p < 0.05.
FIGURE 7.
FIGURE 7.
CARHSP1 inhibits PPARα-mediated transcriptional regulation of gluconeogenic genes. A, the effect of CARHSP1 on PPARα-induced activation of the G6Pc promoter. Serial deletion constructs of the G6Pc promoter were cotransfected with TK-RL into HepG2 cells. After 12 h, cells were infected with Ad-LacZ or Ad-CARHSP1 in the presence or absence of Ad-PPARα for another 48 h. Promoter activities of serial deletion constructs were detected and normalized to Renilla activity. B, CARHSP1 had no effect on the activity of the G6Pc promoter (-159/+80) in which the PPRE was mutated. HepG2 cells were transfected with G6Pc promoter-luc (-159/+80) or G6Pc (-159/+80) Mut-luc. After 12 h, cells were infected with Ad-LacZ or Ad-CARHSP1 in the presence or absence of Ad-PPARα for another 48 h. Activity of the mutated G6Pc promoter was detected and normalized to Renilla activity. The numbers indicate the distance in nucleotides from the transcription start site (+1) of the human G6Pc gene. Representative data are shown from three independent experiments. Data are presented as mean ± S.E. *, p < 0.05; **, p < 0.01. C, HepG2 cells were infected with Ad-LacZ or Ad-CARHSP1 (100 m.o.i.) and after 48 h, ChIP assays were performed using antibodies against PPARα and normal rabbit IgG. Data shown are from three independent experiments. D, C57BL/6J mice were injected with Ad-CARHSP1 or Ad-LacZ (2 × 10⁹ virus particles) by tail vein, n = 4. After 4 days, liver samples were isolated and then CHIP assays were performed using antibodies against PPARα and normal rabbit IgG. Purified DNA fragments were detected by real-time PCR. The primers for the CHIP assays were designed to detect the DNA sequences containing putative PPREs in the promoters of the target genes. Putative PPREs are indicated in horizontal boxes (C and D). Quantitative analysis was performed and normalized against 10% Input. E and F, CARHSP1 fragments (E) and G6Pc promoter (-520)-Luc were cotransfected into HepG2 cells. After 12 h, cells were infected with Ad-LacZ or Ad-PPARα in the presence or absence of Ad-PPARα for another 24 h. Promoter activity was detected and normalized to Renilla activity (F). Data shown are presented as mean ± S.E. *, p < 0.05; **, p < 0.01.
FIGURE 8.
FIGURE 8.
Ablation of PPARα blocks CARHSP1-induced inhibition of gluconeogenesis genes. A and B, CARHSP1 does not interact with HNF4α. coimmunoprecipitation was performed with an antibody against HNF4α in HepG2 cells (A). Normal IgG was used as a negative control. B, HepG2 cells transfected with either HNF4α or pcDNA3.1 for 12 h were then infected with Ad-CARHSP1 or Ad-LacZ (50 m.o.i.) for 24 h. The mRNA expression levels of G6Pc and PEPCK1 were detected by real-time PCR. C and D, HepG2 cells were infected with Ad-CARHSP1 or Ad-LacZ (100 m.o.i.) in the presence or absence of the PPARα antagonist, GW6471 (20 μm) for 48 h in 0.2% FBS medium. E and F, primary mouse hepatocytes isolated from wild-type and PPARα knockout mice were infected with Ad-LacZ or Ad-CARHSP1 (100 m.o.i.) in 10% FBS medium for 24 h followed by a change to 0.2% FBS DMEM for another 24 h. The expression levels of gluconeogenic genes, G6Pc, and PEPCK1 were determined by real-time PCR. Data shown are from three independent experiments and presented as mean ± S.E. *, p < 0.05; **, p < 0.01.
FIGURE 9.
FIGURE 9.
CARHSP1 suppresses hepatic gluconeogenesis. C57BL/6J mice (male, 8–10 weeks old) were injected with Ad-CARHSP1 or Ad-LacZ (2 × 10⁹ virus particles) by tail vein. Four days after adenoviral injection, mice were fasted for 18 h (A and B). A, fasting glucose levels were decreased in Ad-CARHSP1-injected mice. B, pyruvate sodium (2 g/kg intraperitoneally) tolerance tests show that increases in blood glucose levels were attenuated in Ad-CARHSP1-injected mice. Blood glucose levels were determined at the indicated time points (n = 8). □, LacZ; ■, CARHSP1. Data shown are presented as mean ± S.E. *, p < 0.05; **, p < 0.01.

Similar articles

Cited by

References

    1. Boden G., Chen X., Stein T. P. (2001) Am. J. Physiol. Endocrinol. Metab. 280, E23–30 - PubMed
    1. Perriello G., Pampanelli S., Del Sindaco P., Lalli C., Ciofetta M., Volpi E., Santeusanio F., Brunetti P., Bolli G. B. (1997) Diabetes 46, 1010–1016 - PubMed
    1. Wajngot A., Chandramouli V., Schumann W. C., Ekberg K., Jones P. K., Efendic S., Landau B. R. (2001) Metabolism 50, 47–52 - PubMed
    1. Biddinger S. B., Kahn C. R. (2006) Annu. Rev. Physiol. 68, 123–158 - PubMed
    1. Quinn P. G., Yeagley D. (2005) Curr. Drug Targets Immune Endocr. Metabol. Disord. 5, 423–437 - PubMed

Publication types

MeSH terms