. 2012 Feb;26(2):533-45.
doi: 10.1096/fj.11-192377. Epub 2011 Oct 11.

Cigarette smoke exposure induces CFTR internalization and insolubility, leading to airway surface liquid dehydration

Affiliations

Cigarette smoke exposure induces CFTR internalization and insolubility, leading to airway surface liquid dehydration

Lucy A Clunes et al. FASEB J. 2012 Feb.

Abstract

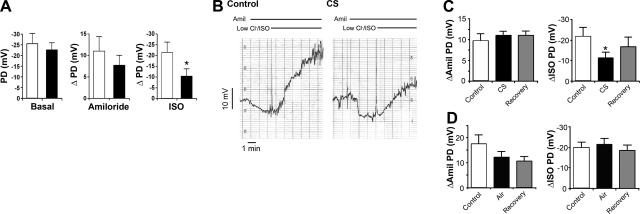
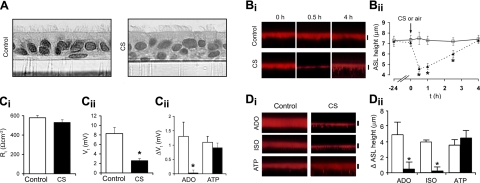
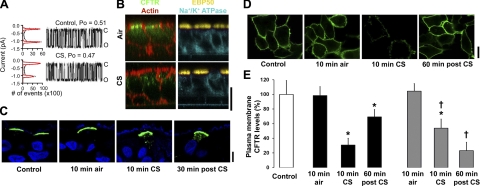
Cigarette smoke (CS) exposure induces mucus obstruction and the development of chronic bronchitis (CB). While many of these responses are determined genetically, little is known about the effects CS can exert on pulmonary epithelia at the protein level. We, therefore, tested the hypothesis that CS exerts direct effects on the CFTR protein, which could impair airway hydration, leading to the mucus stasis characteristic of both cystic fibrosis and CB. In vivo and in vitro studies demonstrated that CS rapidly decreased CFTR activity, leading to airway surface liquid (ASL) volume depletion (i.e., dehydration). Further studies revealed that CS induced internalization of CFTR. Surprisingly, CS-internalized CFTR did not colocalize with lysosomal proteins. Instead, the bulk of CFTR shifted to a detergent-resistant fraction within the cell and colocalized with the intermediate filament vimentin, suggesting that CS induced CFTR movement into an aggresome-like, perinuclear compartment. To test whether airway dehydration could be reversed, we used hypertonic saline (HS) as an osmolyte to rehydrate ASL. HS restored ASL height in CS-exposed, dehydrated airway cultures. Similarly, inhaled HS restored mucus transport and increased clearance in patients with CB. Thus, we propose that CS exposure rapidly impairs CFTR function by internalizing CFTR, leading to ASL dehydration, which promotes mucus stasis and a failure of mucus clearance, leaving smokers at risk for developing CB. Furthermore, our data suggest that strategies to rehydrate airway surfaces may provide a novel form of therapy for patients with CB.


Figures

Figure 1.
Figure 1.
In vivo assessments of whole CS action on CFTR function. A) In vivo NPD measured in nonsmoking control subjects (open bars; n=8) and chronic smokers (solid bars; n=4). Bar graphs show basal NPD and the responses to cumulative mucosal superfusion with amiloride (10−4 M) followed by a low Cl/isoproterenol solution (ISO; 10−5 M). B) Typical paired NPD traces from a nonsmoking subject before (control, left panel) and 10 min after (right panel) acute 10 min CS exposure. Responses of basal PD to cumulative mucosal superfusion with amiloride (10−4 M) and a low-Cl/isoproterenol (10−5 M) are shown (horizontal bars denote drug additions). C) Summary NPD data taken from B. Left panel: change in NPD in response to amiloride (ΔAmil PD) before (control), immediately after CS, and 45 min after CS exposure (recovery). Right panel: change in NPD in response to superfusion with low-Cl/ISO solution for CS-exposed nostrils. n = 5/group. D) NPD data for air-exposed control subjects; n = 4/group. *P < 0.05 vs. control.
Figure 2.
Figure 2.
Effect of CS on airway epithelial CFTR function and airway hydration. A) Light micrographs of paraformaldehyde-fixed HBECs after 10 min air (control) or CS exposure. Bi) Confocal images of ASL height (red) in air-exposed (control) or CS-exposed HBECs. Bii) Graph showing mean ASL height with time after control (solid triangles) or CS (open squares) (both n=6). Ci) Transepithelial resistance Rt before and after CS exposure, measured by EVOM (13). Cii) EVOM electric potential difference Vt measurement of HBECs immediately after air or CS exposure. Ciii) ΔVt of air-exposed (control) or CS-exposed cultures in response to lumenally added adenosine (ADO; 10−5 M) or adenosine triphosphate (ATP; 10−4 M). CTL, all n = 7; CS, all n = 11. Di) Confocal images of ASL height of air-exposed (control) or CS-exposed (smoke) HBECs 10 min after addition of isoproterenol (ISO; 10−5 M, luminal), ADO (10−5 M, luminal), or ATP (10−4 M, luminal). Dii) Mean changes in ASL height for control and CS-exposed HBECs cultures in response to agonists. Control, all n = 6; CS, all n = 6. *P < 0.05 vs. control.
Figure 3.
Figure 3.
CFTR is lost from the plasma membrane during CS exposure. A) Single CFTR channel lipid bilayer recordings. All points in the histogram shown on the left and 2 min of CFTR single-channel recording on the right. Open (O) and closed (C) states are indicated. Top recording shows control conditions; bottom recording depicts the same single channel after CS exposure, blown through the buffer in the trans side. n = 9/group. B) Immunofluorescence analysis of native CFTR (green), EPB50 (yellow), Na+/K+ ATPase (cyan) and actin-phalloidin (red) in HBECs exposed to air or CS. C) Immunofluorescence of HBECs virally infected with CFTRHA (green), counterstained with DAPI (blue), and exposed to 10 min air or CS and fixed either 10 min or 30 min later. D) Surface labeling of HA-CFTR (green) stably expressed in nonpermeabilized BHK cells before exposure, 10 min after air or CS exposure, and 60 min after CS exposure. E) Mean surface CFTR levels in BHKCFTR cultures measured by ELISA. Open bar denotes control. Solid bars denote air and smoke exposure. Shaded bars denote air and CS exposure following 1 h preincubation with 100 nM brefeldin A. Cells were fixed 10 min after air or CS exposure or 60 min after CS exposure (post-CS). n = 16/group. Scale bars = 25 μm. *P < 0.05 vs. control.
Figure 4.
Figure 4.
CFTR protein levels are diminished with CS exposure. A, B) Typical Western blots and densitometric analysis for native CFTR (A) and ENaC (B) in HBECs exposed to 10 min air or CS. C) Typical Western blot of CFTR and actin after exposure to varying puffs of CS during 10-min exposures. Lanes were run on the same gel but were noncontiguous. D) Mean densitometric analysis for CFTR following varying doses of air or CS (n=6/group). E) Western blot of CFTR and actin following the standard 10-min air or CS exposure after 2 h preexposure to vehicle or ALLN. n = 6/group. F) Mean CFTR densitometry after cultures were pretreated with vehicle, ALLN, or MG132 for 2 h prior to CS or air exposure. G) Western blot and mean densitometry of CFTR after air or CS exposure at 21 vs. 4°C. H) Western blot and mean densitometry of CFTR after air vs. CS exposure to intact cultures or to CFTR-containing membrane vesicles. BHK cells were lysed in Nonidet P-40 buffer, and CFTR was probed using the 596 antibody. *P < 0.05 vs. control; P < 0.05 vs. standard CS exposure.
Figure 5.
Figure 5.
Internalized CFTR does not enter lysosomes after CS exposure. Immunofluorescence analysis of HA-CFTR (red) with time vs. the lysosomal marker LAMP1 (green). Surface HA-CFTR was prelabeled at 4°C, and 10 min air or CS exposure was performed at room temperature. Cultures were fixed in MeOH 20 min after CS exposure. Images are representative of experiments performed on 3 separate occasions. Scale bars = 25 μm. Cellular outline was obtained from the transmitted light images and traced over the confocal micrographs in white.
Figure 6.
Figure 6.
CFTR solubility is altered after CS exposure. A) Western blot showing CFTR from BHKCFTR cells lysed following standard exposure to air or CS using Nonidet P-40, or lysis buffer containing 10% SDS. B) Mean densitometry for CFTR taken from A. n = 6/group. C) Western blot showing CFTR from polarized CALU3 airway epithelial cultures lysed using Nonidet P-40 vs. 10% SDS before (control) and after the standard single CS exposure. D) Representative immunofluorescence of CFTR stably expressed in BHK cells following exposure to air or acute CS and either fixation in paraformaldehyde (PFA) followed by permeablization with Triton-X (Tx) or by fixation/permeablization with methanol (MeOH). In all cases, cells were then probed with the 596 CFTR antibody; confocal microscope laser/gain settings were identical for all images. E) CFTR expression levels, normalized to 18 S, in polarized CALU3 cultures chronically exposed to CS (see Materials and Methods). F, G) Western blot (F) and mean densitometry (G) for polarized CALU3 cultures chronically exposed to CS and lysed in Nonidet P-40 or 10% SDS. Scale bar = 25 μm. Open bars denote air exposure. Solid bars denote CS exposure. *P < 0.05 vs. air; P < 0.05 vs. CFTR in Nonidet P-40 buffer.
Figure 7.
Figure 7.
CFTR associates with vimentin after CS exposure. Immunofluorescence analysis of HA-CFTR (red) with time vs. the intermediate filament vimentin (green). Surface HA-CFTR was prelabeled at 4°C, 10 min air or CS exposures were performed at room temperature, and cultures were fixed in MeOH at timed intervals thereafter. Transmitted light images were simultaneously obtained, and the outline of the cells is traced (white) over the CFTR and vimentin images. Images are representative of experiments performed on 3 separate occasions. Scale bars = 10 μm.
Figure 8.
Figure 8.
HS reverses CS-induced ASL dehydration and restores mucus clearance in patients with CB. A) Confocal micrographs of ASL height (red) after CS or air (control) exposure. B) Mean data taken from A. Control, solid squares; CS, solid triangles; n = 6/group. C) Whole-lung radioparticle retention (indexed as fraction of total deposited radiotracer remaining in the lung with time) as a function of vehicle (solid circles) or 7% HS (solid squares) pretreatment in CB subjects. D) Mean rate of clearance of radiotracer over 30 min for control healthy subjects (open bars; n=20) and CB subjects pretreated with vehicle (baseline; solid bars; n=7) or 7% HS (shaded bars; n=7). *P < 0.05 vs. control or healthy baseline; P ≤ 0.05 vs. CB baseline.

References

    1. Mannino D. M., Homa D. M., Akinbami L. J., Ford E. S., Redd S. C. (2002) Chronic obstructive pulmonary disease surveillance–United States, 1971–2000. MMWR Surveill. Summ. 51, 1–16 - PubMed
    1. Gerald L. B., Bailey W. C. (2002) Global initiative for chronic obstructive lung disease. J. Cardiopulm. Rehabil. 22, 234–244 - PubMed
    1. Barnes P. J. (2004) Mediators of chronic obstructive pulmonary disease. Pharmacol. Rev. 56, 515–548 - PubMed
    1. Calverley P. M., Anderson J. A., Celli B., Ferguson G. T., Jenkins C., Jones P. W., Yates J. C., Vestbo J. (2007) Salmeterol and fluticasone propionate and survival in chronic obstructive pulmonary disease. N. Engl. J. Med. 356, 775–789 - PubMed
    1. Cantin A. M., Hanrahan J. W., Bilodeau G., Ellis L., Dupuis A., Liao J., Zielenski J., Durie P. (2006) Cystic fibrosis transmembrane conductance regulator function is suppressed in cigarette smokers. Am. J. Respir. Crit. Care. Med. 173, 1139–1144 - PubMed

Publication types

MeSH terms

LinkOut - more resources