. 2012 Jan;26(1):309-23.
doi: 10.1096/fj.11-190892. Epub 2011 Oct 11.

Ablation of the transcriptional regulator Id1 enhances energy expenditure, increases insulin sensitivity, and protects against age and diet induced insulin resistance, and hepatosteatosis

Affiliations

Ablation of the transcriptional regulator Id1 enhances energy expenditure, increases insulin sensitivity, and protects against age and diet induced insulin resistance, and hepatosteatosis

Ande Satyanarayana et al. FASEB J. 2012 Jan.

Abstract

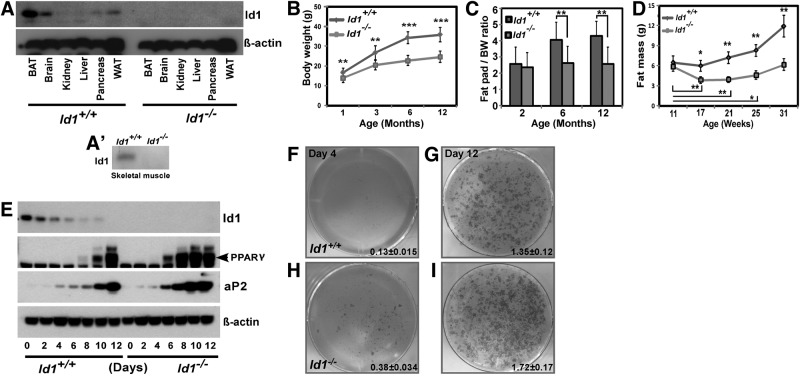
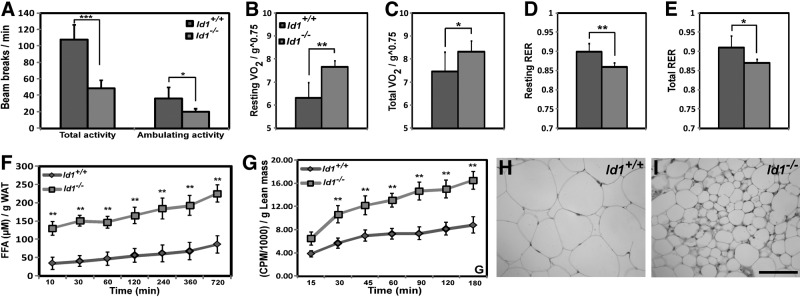
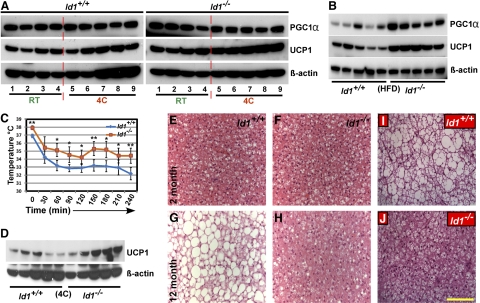
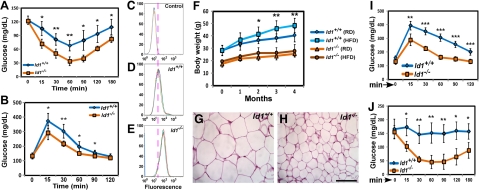
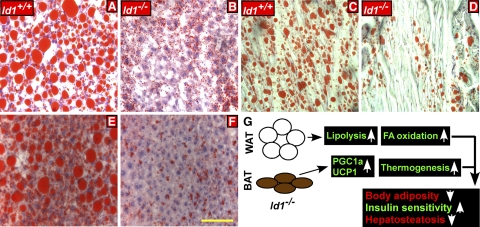
Obesity is a major health concern that contributes to the development of diabetes, hyperlipidemia, coronary artery disease, and cancer. Id proteins are helix-loop-helix transcription factors that regulate the proliferation and differentiation of cells from multiple tissues, including adipocytes. We screened mouse tissues for the expression of Id1 and found that Id1 protein is highly expressed in brown adipose tissue (BAT) and white adipose tissue (WAT), suggesting a role for Id1 in adipogenesis and cell metabolism. Id1(-/-) mice are viable but show a significant reduction in fat mass (P<0.005) over the life of the animal that was not due to decreased number of adipocytes. Analysis of Id1(-/-) mice revealed higher energy expenditure, increased lipolysis, and fatty acid oxidation, resulting in reduced triglyceride accumulation in WAT compared to Id1(+/+) mice. Serum levels of triglycerides (193.9±32.2 vs. 86.5±33.8, P<0.0005), cholesterol (189.4±33.8 vs. 110.6±8.23, P<0.0005) and leptin (1263±835 vs. 222±260, P<0.005) were significantly lower in aged Id1(-/-) mice compared to Id1(+/+) mice. Id1-deficient mice have higher resting (P<0.005) and total (P<0.05) O(2) consumption and lower respiratory exchange ratio (P<0.005), confirming that Id1(-/-) mice use a higher proportion of lipid as an energy source for the increased energy expenditure. The expression of PGC1α and UCP1 were 2- to 3-fold up-regulated in Id1(-/-) BAT, suggesting that loss of Id1 increases thermogenesis. As a consequence of higher energy expenditure and reduced fat mass, Id1(-/-) mice displayed enhanced insulin sensitivity. Id1 deficiency protected mice against age- and high-fat-diet-induced adiposity, insulin resistance, and hepatosteatosis. Our findings suggest that Id1 plays a critical role in the regulation of energy homeostasis and could be a potential target in the treatment of insulin resistance and fatty liver disease.


Figures

Figure 1.
Figure 1.
Reduced adiposity in Id1−/− mice. A) Expression levels of Id1 protein and loading control β-actin in the indicated mouse tissues. A′) Expression level of Id1 protein in the skeletal muscle of Id1+/+ and Id1−/− mice. B) Body weights of female (n=18–24/group) mice at the indicated age. **P < 0.005; ***P < 0.0005. C) Weight of epididymal fat pads (n=12/group) at the indicated age, normalized to body weight. D) Total fat mass measured by NMR at the indicated age (n=6/group). E) Expression levels of Id1 protein, markers of adipogenesis PPARγ and aP2, and loading control β-actin in Id1+/+ and Id1−/− cells after induction of adipogenesis at the indicated time points. F–I) Representative photos of Oil Red O-stained Id1+/+ (F, G) and Id1−/− (H, I) MEFs undergoing adipocyte differentiation at d 4 (F, H) and d 12 (G, I); n = 6/genotype; 3 independent experiments were conducted. Oil Red O-stained cells were destained with isopropanol; amount of staining was quantified by reading absorbance at 510 nm.
Figure 2.
Figure 2.
Increased energy expenditure in Id1−/− mice. A) Total and ambulatory activity levels over a 24-h period at RT (n=8/group). B, C) Resting (B) and total (C) O2 consumption at RT (n=6/group), normalized to lean mass. D, E) Resting (D) and total (E) respiratory exchange ratio (RER) at RT (n=6/group). F) Amount of FFA released per gram of Id1+/+ and Id1−/− WAT explants in vitro (n=5/group) in the presence of isoproterenol. I) In vivo FA oxidation rates in Id1+/+ and Id1−/− mice (n=5/group) at the indicated time points. H, I) H&E-stained sections of inguinal fat of 6-mo-old Id1+/+ (H) and Id1−/− (I) mice. Scale bar = 100 μm. *P < 0.05; **P < 0.005; ***P < 0.0005.
Figure 3.
Figure 3.
Enhanced expression of thermogenic proteins in Id1−/− BAT. A) Whole-cell lysates were prepared from the BAT of 2-mo-old Id1+/+ and Id1−/− mice at RT or after exposing the mice to 4°C for 4 h. Expression levels of PGC1α and UCP1 proteins were measured in Id1+/+ and Id1−/− tissues (n=4–5/genotype) by Western blot analysis under the indicated condition. After running the protein and transferring and probing the membranes with antibodies, the membranes were exposed simultaneously to the same film for same amount of time. B) Expression levels of PGC1α and UCP1 in the BAT of HFD-fed Id1+/+ and Id1−/− mice. C) Rectal temperature of Id1+/+ and Id1−/− mice after exposing them to 4°C for 4 h. Body temperature was recorded at 30-min intervals. D) Expression levels of UCP1 in the BAT of 6-mo-old Id1+/+ and Id1−/− mice after exposing the mice to 4°C for 4 h. β-Actin was used as loading control. E, H) H&E-stained interscapular BAT of 2- and 12-mo-old Id1+/+ (E) and Id1−/− (F) mice. I, J) H&E-stained interscapular BAT of HFD fed Id1+/+ (I) and Id1−/− (J) mice. Scale bar = 100 μm.
Figure 4.
Figure 4.
Id1 deletion protects against HFD-induced insulin resistance. A, B) ITTs (A) and GTTs (B) in 2-mo-old mice (n=6/genotype), showing the changes in blood glucose levels at the indicated time points. C–E) Glucose uptake in adipocytes, measured by FACS following 30 min exposure to 2-NBDG in the presence of insulin; negative control (C), Id1+/+ adipocytes (D), and Id1−/− adipocytes (E) treated with 2-NBDG (n=4/group). F) Body weights of RD- and HFD-fed male mice (n=18/group) at the indicated time points. G, H) H&E-stained sections of inguinal fat from HFD fed Id1+/+ (G) and Id1−/− (H) mice. Scale bar = 100 μm. I, J) GTTs (I) and ITTs (J) in HFD-fed Id1+/+ and Id1−/− male mice (n=5/group), showing the changes in blood glucose levels at the indicated time points. *P < 0.05; **P < 0.005; ***P < 0.0005.
Figure 5.
Figure 5.
Id1 deletion prevents HFD-induced hepatic steatosis. A–D) Oil Red O-stained liver sections (A, B) and sections of skeletal muscles (C, D) of HFD fed Id1+/+ (A, C) and Id1−/− (B, D) mice. E, F) Oil Red O-stained liver sections of 1-yr-old Id1+/+ (E) and Id1−/− (F) mice fed RD. Scale bar = 100 μm. G) Schematic showing the consequence of loss of Id1 on adipose tissue metabolism.

Similar articles

Cited by

References

    1. Spiegelman B. M., Flier J. S. (1996) Adipogenesis and obesity: rounding out the big picture. Cell 87, 377–389 - PubMed
    1. Klaus S. (1997) Functional differentiation of white and brown adipocytes. Bioessays 19, 215–223 - PubMed
    1. Galic S., Oakhill J. S., Steinberg G. R. (2010) Adipose tissue as an endocrine organ. Mol. Cell. Endocrinol. 316, 129–139 - PubMed
    1. Kajimura S., Seale P., Spiegelman B. M. (2010) Transcriptional control of brown fat development. Cell. Metab. 11, 257–262 - PMC - PubMed
    1. Ricquier D. (2005) Respiration uncoupling and metabolism in the control of energy expenditure. Proc. Nutr. Soc. 64, 47–52 - PubMed

Publication types

MeSH terms

Substances