. 2011 Aug 22:5:83.
doi: 10.3389/fnhum.2011.00083. eCollection 2011.

Changes in cognitive state alter human functional brain networks

Affiliations

Changes in cognitive state alter human functional brain networks

Malaak Nasser Moussa et al. Front Hum Neurosci. .

Abstract

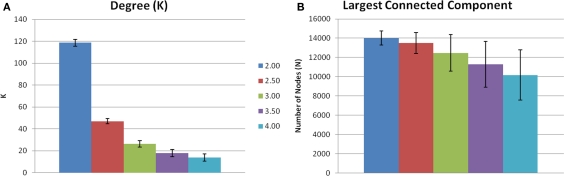
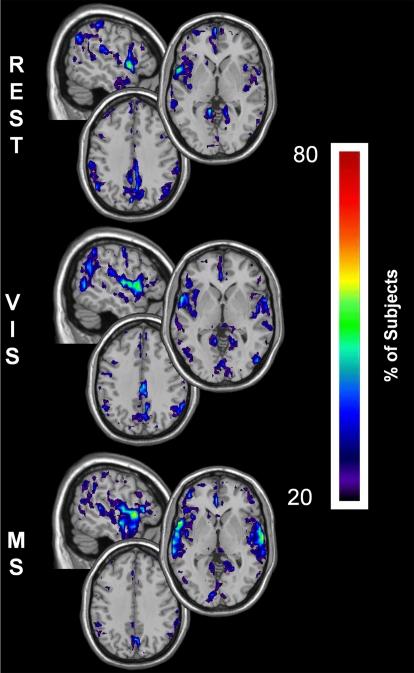
The study of the brain as a whole system can be accomplished using network theory principles. Research has shown that human functional brain networks during a resting state exhibit small-world properties and high degree nodes, or hubs, localized to brain areas consistent with the default mode network. However, the study of brain networks across different tasks and or cognitive states has been inconclusive. Research in this field is important because the underpinnings of behavioral output are inherently dependent on whether or not brain networks are dynamic. This is the first comprehensive study to evaluate multiple network metrics at a voxel-wise resolution in the human brain at both the whole-brain and regional level under various conditions: resting state, visual stimulation, and multisensory (auditory and visual stimulation). Our results show that despite global network stability, functional brain networks exhibit considerable task-induced changes in connectivity, efficiency, and community structure at the regional level.

Keywords: efficiency; modularity; network science; small-world; task-based.


Figures

Figure 1
Figure 1
Threshold-dependent changes in network connectivity. (A) Shows the mean node degree across five thresholds. Mean degree was relatively consistent across thresholds 2.5–4.0. However, S = 2.0 there is an increase in mean degree indicating a loss of sparsity. (B) Is the number of voxels contained in the largest connected component. There is a gradual loss of nodes in the largest connected component as S increases.
Figure 2
Figure 2
Assortativity of a representative subject. Assortativity (Rjk) for a single subject across all three conditions (rest, visual, and multisensory). The matrix depicts the degree of all connected nodes, generated by plotting the degree of each node on either end of each network edge. The warm region in the upper left corner of the plots denotes that the majority of network nodes have a low degree and are connected with other low degree nodes. The assortativity plots for the rest (REST), visual (VIS), and multisensory (MS) tasks all show a positive assortativity, in which nodes with similar degree are connected.
Figure 3
Figure 3
Assortativity sorted by degree. Above are the connection probabilities of the 80% lowest degree nodes and the top 20% highest degree nodes. For all three conditions rest (REST), visual (VIS), and multisensory (MS), the positive network assortativity was heavily weighted by low degree nodes. In each case, low degree nodes were connected with low degree nodes, peaking at nodes with a degree of around 25. On the other hand, high degree nodes’ connections were dispersed with a broad range of other degree nodes.
Figure 4
Figure 4
Whole-brain degree distributions. The degree of each node in a network was plotted against one minus the cumulative distribution. This was done for each individual in all three tasks: rest (REST), visual (VIS), and multisensory (MS). In all three cases, the degree distribution followed an exponentially truncated power law. No obvious differences between the tasks were observed.
Figure 5
Figure 5
Degree overlay maps during rest, visual, and multisensory tasks. In each subject the voxels with degree values in the top 15% were identified. These maps represent the overlap of these voxels across subjects in each of the three tasks. The consistency of overlap between across subjects is indicated by the threshold color bar that which represents the percentage of individuals for which each voxel was among the top 15%. Degree maps show that at rest (REST) the parietal cortex has the greatest connectivity while the visual cortex has lower degree. There is a regional shift in degree during the visual task (VIS) to the visual cortex and to both the visual and auditory cortex during the multisensory task (MS).
Figure 6
Figure 6
Local efficiency overlay maps during rest, visual, and multisensory tasks. In each subject the voxels with local efficiency values in the top 15% were identified. These maps represent the overlap of these voxels across subjects in each of the three tasks. The consistency of overlap across subjects is indicated by the threshold color bar that represents the percentage of individuals. Eloc maps show that at rest (REST) the visual and parietal cortices have the greatest clustering. Regions of high clustering shift during the visual task (VIS) to the visual cortex and to both the visual and auditory cortex during the multisensory task (MS). A progressive decrease in the local efficiency in the parietal cortex was observed across the three tasks.
Figure 7
Figure 7
Global efficiency overlay maps, during rest, visual, and multisensory tasks. In each subject the voxels with global efficiency values in the top 15% were identified. These maps represent the overlap of these voxels across subjects in each of the three tasks. The consistency of overlap across subjects is indicated by the threshold color bar that represents the percentage of individuals. Eglob maps show that at rest (REST) the visual and parietal regions have the greatest across-network communication. There is a primary regional shift in global efficiency during the visual task (VIS) to the visual cortex and to both the visual and auditory cortices during the multisensory task (MS). In addition to this, there is a decrease in global efficiency within the parietal cortex across the three tasks. Note however, the relative change in the spatial location of high Eglob nodes was limited compared to K and Eloc.
Figure 8
Figure 8
Change in spatial distribution of auditory module across task. The auditory module for each individual was selected using a mask that was defined by the primary auditory cortex, specifically bilateral Heschl's gyri and transverse temporal sulci. After identification of the modules that encompassed auditory cortex in each individual, overlay images were generated for each task. Overlay images represent the summation of individual participant maps. The degree of overlay between these maps is indicated by the threshold color bar, which represents the percentage of participants. The spatial extent of the auditory module across tasks is shown to become more specific to both primary and secondary auditory cortices in the multisensory condition (MS). These modules, on the other hand, show less specificity to the auditory cortices in the conditions that do not have auditory stimulation: rest (REST) and visual (VIS).
Figure 9
Figure 9
Change in spatial distribution of visual module across task. The same steps for generating auditory overlay maps were followed in order to create visual overlay maps. However, brain areas that composed the mask included: bilateral calcarine gyri, lingual gyri, occipital (superior; middle; inferior) sulci, and the cuneus. The spatial extent of the visual module across task is shown to remain relatively the same in all three conditions: rest (REST), visual (VIS), and multisensory (MS). Group overlap or consistency, on the other hand, exhibits an increase in both the visual and multisensory conditions.
Figure 10
Figure 10
Change in spatial distribution of provincial hubs across tasks. Individual participant provincial hub (pki ≤ 0.01 and pci ≤ 0.3) maps were summated within each task to create an overlay image of spatial distribution within brain space. Note that the consistency of the provincial hubs is generally lower than the overlap presented in the preceding figures. However, there is a clear change in provincial node location across tasks. The rest (REST) condition shows with the greatest number and overlap of provincial hubs between participants in the precuneus, a brain region known to be part of the DMN. The number and overlap of provincial hubs in the visual and auditory cortices increases during the visual (VIS) and multisensory (MS) tasks. In addition, the precuneus loses provincial hubs during the sensory stimulation conditions.
Figure 11
Figure 11
Change in hub proportions across task. Hubs are defined as having a pki ≤ 0.01. Provincial (yellow; pci ≤ 0.3) and connector (magenta; 0.3 < pci ≤ 0.75) hubs as well as non-hubs (blue; pki > 0.01) are plotted across task condition. In both auditory and visual modules, there was no change in the proportion of non-hubs across task. In the auditory module (A), a main effect of task was found for the proportion of hubs across condition. Connectors significantly decreased across task, with multisensory (MS) having the lowest proportion. In contrast, the proportion of provincial hubs increased across task, with rest (REST) having the lowest proportion. In the occipital module (B), no main effect of condition was found on the proportion of either hub type.

References

    1. Ashburner J., Friston K. J. (2005). Unified segmentation. Neuroimage 26, 839–85110.1016/j.neuroimage.2005.02.018 - DOI - PubMed
    1. Babor T. F., Higgins-Biddle J. C., Saunders J. B., Monteiro M. G. (2001). AUDIT: The Alcohol Use Disorders Identification Test: Guidelines for Use in Primary Care. 2nd Edn. World Health Organization, Geneva
    1. Bassett D. S., Bullmore E., Verchinski B. A., Mattay V. S., Weinberger D. R., Meyer-Lindenberg A. (2008). Hierarchical organization of human cortical networks in health and schizophrenia. J. Neurosci. 28, 9239–924810.1523/JNEUROSCI.1929-08.2008 - DOI - PMC - PubMed
    1. Beckmann C. F., DeLuca M., Devlin J. T., Smith S. M. (2005). Investigations into resting-state connectivity using independent component analysis. Philos. Trans. R. Soc. Lond. B Biol. Sci. 360, 1001–101310.1098/rstb.2005.1634 - DOI - PMC - PubMed
    1. Biswal B., Yetkin F. Z., Haughton V. M., Hyde J. S. (1995). Functional connectivity in the motor cortex of resting human brain using echo-planar MRI. Magn. Reson. Med. 34, 537–54110.1002/mrm.1910340409 - DOI - PubMed

LinkOut - more resources