. 2011;6(10):e25590.
doi: 10.1371/journal.pone.0025590. Epub 2011 Oct 3.

Impact of the genome on the epigenome is manifested in DNA methylation patterns of imprinted regions in monozygotic and dizygotic twins

Affiliations

Impact of the genome on the epigenome is manifested in DNA methylation patterns of imprinted regions in monozygotic and dizygotic twins

Marcel W Coolen et al. PLoS One. 2011.

Abstract

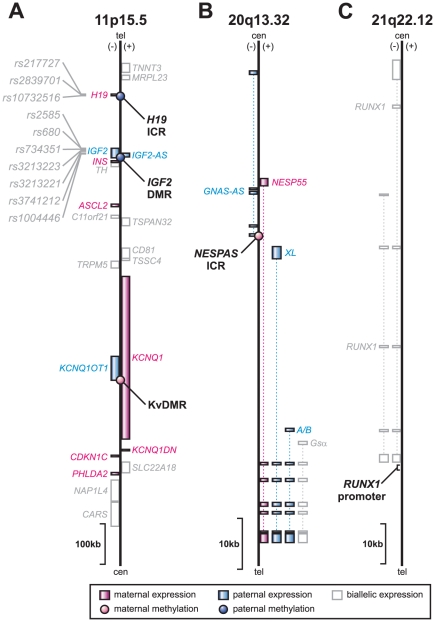
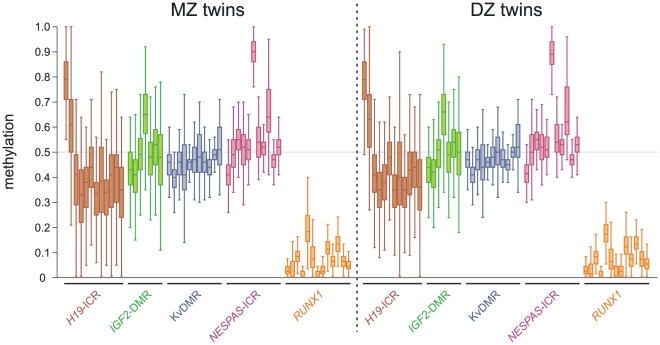
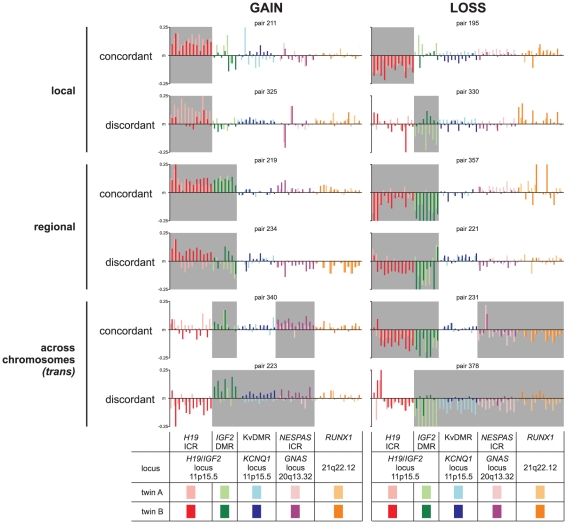
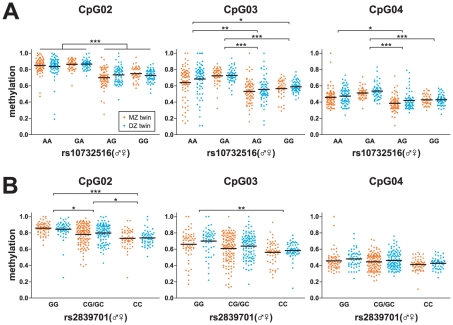
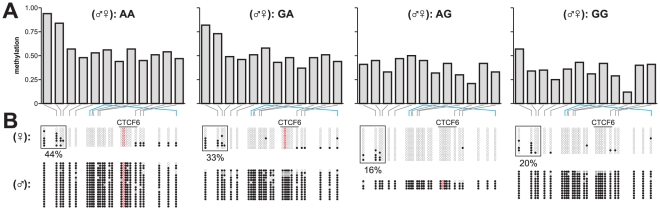
One of the best studied read-outs of epigenetic change is the differential expression of imprinted genes, controlled by differential methylation of imprinted control regions (ICRs). To address the impact of genotype on the epigenome, we performed a detailed study in 128 pairs of monozygotic (MZ) and 128 pairs of dizygotic (DZ) twins, interrogating the DNA methylation status of the ICRs of IGF2, H19, KCNQ1, GNAS and the non-imprinted gene RUNX1. While we found a similar overall pattern of methylation between MZ and DZ twins, we also observed a high degree of variability in individual CpG methylation levels, notably at the H19/IGF2 loci. A degree of methylation plasticity independent of the genome sequence was observed, with both local and regional CpG methylation changes, discordant between MZ and DZ individual pairs. However, concordant gains or losses of methylation, within individual twin pairs were more common in MZ than DZ twin pairs, indicating that de novo and/or maintenance methylation is influenced by the underlying DNA sequence. Specifically, for the first time we showed that the rs10732516 [A] polymorphism, located in a critical CTCF binding site in the H19 ICR locus, is strongly associated with increased hypermethylation of specific CpG sites in the maternal H19 allele. Together, our results highlight the impact of the genome on the epigenome and demonstrate that while DNA methylation states are tightly maintained between genetically identical and related individuals, there remains considerable epigenetic variation that may contribute to disease susceptibility.


Conflict of interest statement

Competing Interests: The authors have declared that no competing interests exist.

Figures

Figure 1
Figure 1. Genomic regions interrogated.
Four imprinted regions were tested for their DNA methylation levels: (A) three are located in close proximity of each other on 11p15.5: H19-ICR, IGF2-DMR and KvDMR, and (B) one is located on 20q13.32: NESPAS-ICR. (C) As a non-imprinted region the RUNX1 promoter was interrogated. Features on the (+) and (−) strand are shown to the right or left of the line, respectively. The imprinting status of the genes is shown in pink (maternally expressed), blue (paternally expressed), and white (biallelic expression or imprinted expression not known). Intronic regions are indicated as dotted lines. Imprinting control regions and differentially methylated regions (ICR and DMR, respectively) are marked by circles coloured according to the parental origin of the imprint (tel: telomeric end; cen: centromeric end [adapted from 2], [43]). Single nucleotide polymorphisms interrogated in this study are also indicated on 11p15.5.
Figure 2
Figure 2. DNA methylation levels at four imprinted loci and the RUNX1 promoter in MZ and DZ twins.
Box plot results of the DNA methylation levels are shown per CpG unit as determined by MALDI-TOF mass spectrometry. Each box plot shows the distribution of DNA methylation in 256 monozygotic (MZ) or dizygotic (DZ) individuals (left or right panel, respectively; brown: H19-ICR; green: IGF2-DMR; blue: KvDMR; pink: NESPAS-ICR; orange: RUNX1).
Figure 3
Figure 3. Correlation matrix of DNA methylation levels between all CpG units.
The nonparametric Spearman correlation scores between the DNA methylation levels of different CpG units are displayed in a 2D matrix in shades of blue and yellow (for positive and negative values, respectively). All correlation scores above 0.23 are significant (two-tailed, P-value<0.0001).
Figure 4
Figure 4. Gene-level analysis of intra-twin discordance in DNA methylation.
The discordance in DNA methylation levels was calculated within monozygotic twin pairs, dizygotic twin pairs and between non-related individuals (MZ, DZ and NR, respectively). The methylation differences between individuals were summed over a region and displayed as scatter plots with a horizontal black line representing the group median (see Figures S2, S3, S4, S5, S6 for intra-twin comparisons at each individual CpG unit). Significant differences between groups were identified using the non-parametric Kruskal-Wallis test, followed by a Dunn's multiple comparison test. In H19-ICR, the methylation discordance was significantly less in MZ twin pairs than in DZ pairs, or between non-related individuals. Within the RUNX1 promoter, the non-related individuals displayed the greatest discordance over MZ or DZ twin pairs (*: P-value<0.05; **: P-value<0.01; ***: P-value<0.001).
Figure 5
Figure 5. Examples of monozygotic twin pairs with aberrant DNA methylation levels.
Typical examples are shown of monozygotic twin pairs harbouring gains or losses in DNA methylation levels relative to the median (m), highlighted in grey. The gains or losses - either concordant or discordant - can be observed within the twin pairs and the aberrations can be local (only one chromosomal region), regional (nearby regions in the genome) or even across different chromosomes (in trans). Y-axis shows the DNA methylation difference from the median (m). Colour legends and locus info are shown below the graphs.
Figure 6
Figure 6. Influence of rs10732516 and rs2839701 on the DNA methylation levels in the H19-ICR region.
(A) DNA methylation results are sorted on the rs10732516 genotype, where the parent of origin is also taken into account. The rs10732516 [AA] and [GA] genotypes ([♂♀]) display elevated DNA methylation levels compared to [AG] and [GG] genotypes. These differences in DNA methylation are visible throughout the H19-ICR locus but are most apparent for CpG sites 2, 3 and 4. (B) Similarly, DNA methylation results are sorted based on the rs2839701 genotype. For CpG sites 2, 3 and 4 in the H19-ICR region, the rs2839701 [G] allele is associated with a higher DNA methylation compared to the [C] allele. These results show that both polymorphisms within the IGF2/H19 region may predict or influence the DNA methylation status in individuals. Significant differences between groups were identified using the non-parametric Kruskal-Wallis test, followed by a Dunn's multiple comparison test (*: P-value<0.05; **: P-value<0.01; ***: P-value<0.001).
Figure 7
Figure 7. Clonal bisulphite sequencing of H19-ICR in individuals with different rs10732516 genotypes.
The DNA methylation levels in four samples with different rs10732516 genotypes were further investigated via clonal bisulphite sequencing. (A) MassCleave data for H19-ICR of the four genotypes. (B) Clonal bisulphite sequencing analysis of the samples confirmed the genotype of the rs10732516 polymorphism (the [A] allele highlighted in red). In addition, the hypermethylated state of the maternal rs10732516 [A] allele was confirmed. The maternal [A] allele in the [AA] and [GA] individuals displayed higher methylation levels at the 5′-end of the H19-ICR than the maternal [G] allele in [AG] or [GG] individuals (44% and 33% versus 16% and 20%, respectively; boxed regions).
Figure 8
Figure 8. Putative functional implication of rs10732516 on CTCF binding in the H19-ICR region.
(A) The Position Weight Matrix (PWM) of the CTCF consensus sequence as determined by Cuddapah et al. (2009) harbours a strong preference for a cytosine residue at position 6 of the PWM. Within the region upstream the H19 gene, this cytosine is present in CTCF binding site numbers 4 and 6 (for the rs10732516 [G] allele) . The CTCF binding site number 5 within the H19 region harbours a thymidine at position 6, and is identical in sequence to CTCF binding site number 6 for the rs10732516 [A] allele (CTCF sequences are on the minus strand). (B) Analysis of CTCF binding at the H19 promoter region covering CTCF binding sites 4, 5 and 6 in six normal cell lines identified site number 5 to have minimal binding affinity within the region (ChIP-seq data from the ENCODE Chromatin Group at the Broad Institute ; UCSC Genome Browser; HMEC: human mammary epithelial cells; HSMM: normal human skeletal muscle myoblasts; HUVEC: human umbilical vein endothelial cells; NHEK: normal human epidermal keratinocytes; NHLF: normal human lung fibroblasts; H1ES: human embryonic stem cell line H1). (C) Effect of cytosine versus thymidine at position 6 of the PWM on the average enrichment score near CTCF sites within the genome of HMEC cells. Positions matching the PWM with 80% or greater sequence identity were identified and the average enrichment scores near these sites were determined −500 to +500 base pairs relative to the CTCF motif. Results for the other cell lines can be found as Figure S8. These combined results suggest a strong influence of the rs10732516 genotype on the binding affinity of CTCF at this position in the H19-ICR.

References

    1. Li E, Beard C, Jaenisch R. Role for DNA methylation in genomic imprinting. Nature. 1993;366:362–365. - PubMed
    1. Reik W, Walter J. Genomic imprinting: parental influence on the genome. Nat Rev Genet. 2001;2:21–32. - PubMed
    1. Bartolomei MS, Zemel S, Tilghman SM. Parental imprinting of the mouse H19 gene. Nature. 1991;351:153–155. - PubMed
    1. DeChiara TM, Robertson EJ, Efstratiadis A. Parental imprinting of the mouse insulin-like growth factor II gene. Cell. 1991;64:849–859. - PubMed
    1. Thorvaldsen JL, Duran KL, Bartolomei MS. Deletion of the H19 differentially methylated domain results in loss of imprinted expression of H19 and Igf2. Genes Dev. 1998;12:3693–3702. - PMC - PubMed

Publication types

MeSH terms