. 2011;6(10):e25824.
doi: 10.1371/journal.pone.0025824. Epub 2011 Oct 3.

High macroalgal cover and low coral recruitment undermines the potential resilience of the world's southernmost coral reef assemblages

Affiliations

High macroalgal cover and low coral recruitment undermines the potential resilience of the world's southernmost coral reef assemblages

Andrew S Hoey et al. PLoS One. 2011.

Abstract

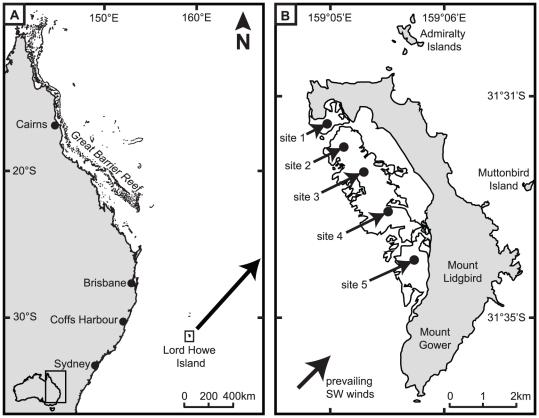
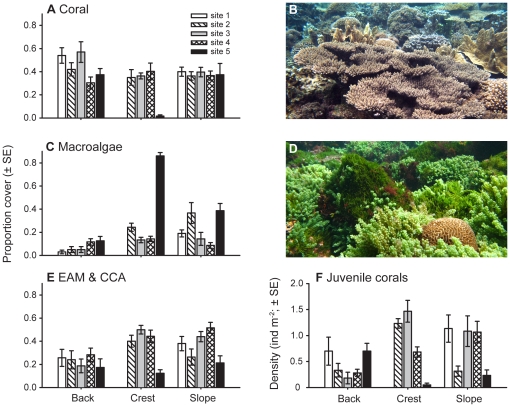
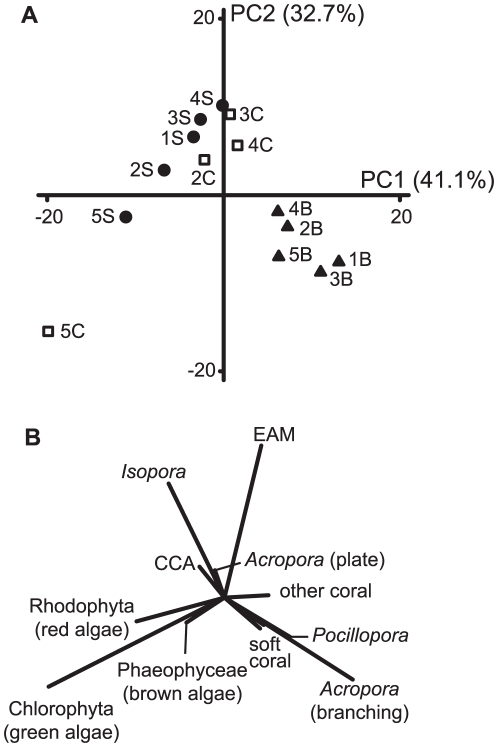
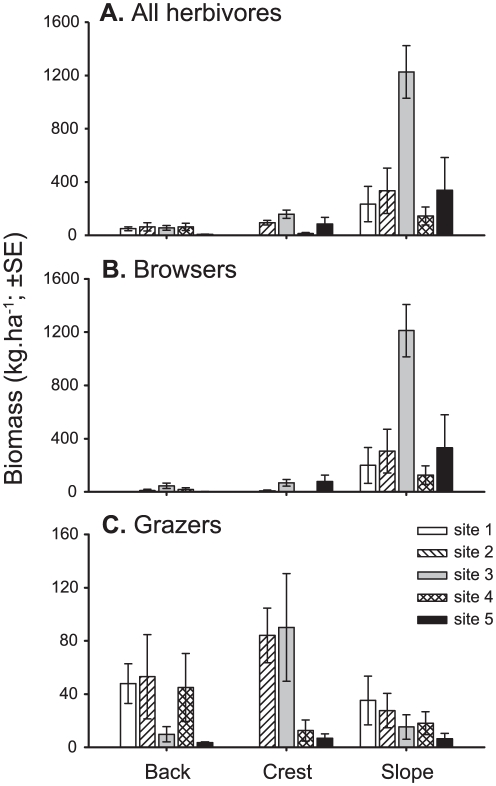
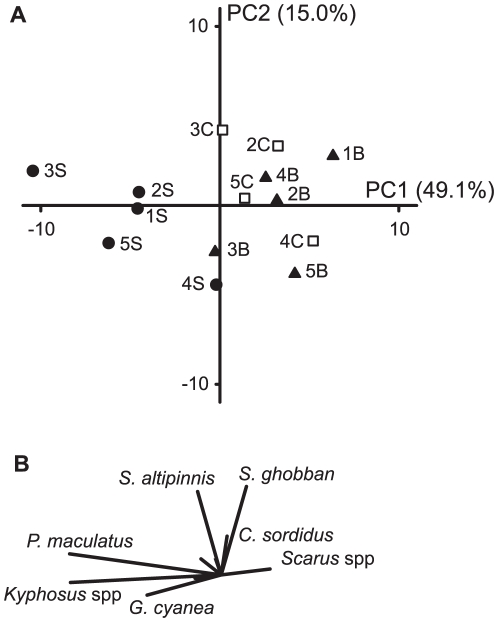
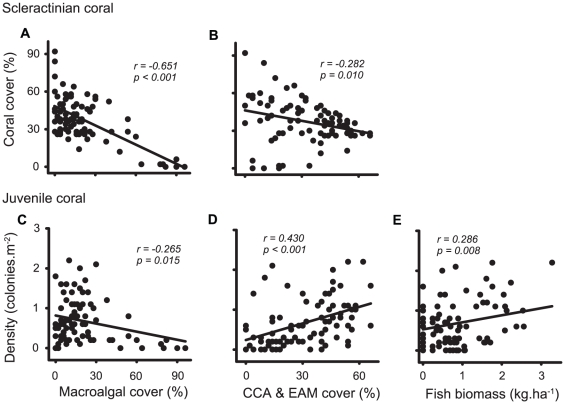
Coral reefs are under increasing pressure from anthropogenic and climate-induced stressors. The ability of reefs to reassemble and regenerate after disturbances (i.e., resilience) is largely dependent on the capacity of herbivores to prevent macroalgal expansion, and the replenishment of coral populations through larval recruitment. Currently there is a paucity of this information for higher latitude, subtropical reefs. To assess the potential resilience of the benthic reef assemblages of Lord Howe Island (31°32'S, 159°04'E), the worlds' southernmost coral reef, we quantified the benthic composition, densities of juvenile corals (as a proxy for coral recruitment), and herbivorous fish communities. Despite some variation among habitats and sites, benthic communities were dominated by live scleractinian corals (mean cover 37.4%) and fleshy macroalgae (20.9%). Live coral cover was higher than in most other subtropical reefs and directly comparable to lower latitude tropical reefs. Juvenile coral densities (0.8 ind.m(-2)), however, were 5-200 times lower than those reported for tropical reefs. Overall, macroalgal cover was negatively related to the cover of live coral and the density of juvenile corals, but displayed no relationship with herbivorous fish biomass. The biomass of herbivorous fishes was relatively low (204 kg.ha(-1)), and in marked contrast to tropical reefs was dominated by macroalgal browsing species (84.1%) with relatively few grazing species. Despite their extremely low biomass, grazing fishes were positively related to both the density of juvenile corals and the cover of bare substrata, suggesting that they may enhance the recruitment of corals through the provision of suitable settlement sites. Although Lord Howe Islands' reefs are currently coral-dominated, the high macroalgal cover, coupled with limited coral recruitment and low coral growth rates suggest these reefs may be extremely susceptible to future disturbances.


Conflict of interest statement

Competing Interests: The authors have declared that no competing interests exist.

Figures

Figure 1
Figure 1. Map showing location of study sites.
A. Map of the east coast of Australia showing the geographic location of Lord Howe Island. B. Map of Lord Howe Island, showing the location of the five sites used to quantify the benthic composition and herbivorous fish community. At each site the three habitats were sampled; the reef slope (8–10 m depth), the reef crest (2–4 m), and the back reef (1–3 m).
Figure 2
Figure 2. Spatial variation in benthic assemblages on Lord Howe Island.
Variation in the (A) cover of live scleractinian coral, (C) cover of macroalgae, (E) cover of the crustose coralline algae (CCA) and epilithic algal matrix (EAM), and (F) density of juvenile corals (<50 mm diameter) among three habitats and five sites on Lord Howe Island. Each mean is based on six transects. (B) A diverse coral-dominated assemblage in the back reef at site 3 on Lord Howe Island, (photo A.H. Baird) and (D) a macroalgal-dominated assemblage on the reef crest at the site 5, the southernmost site. High cover of Caulerpa racemosa and C. taxifolia surrounding small faviid colony.
Figure 3
Figure 3. Principal component analysis showing the relationships among benthic assemblages on Lord Howe Island.
(A) Ordination plot showing the relationship between fourteen locations. Each location is based on six 50-m point-intercept transects. Solid circles: reef slope locations; open squares: reef crest locations; solid triangles: back reef locations. Numbers refer to sites identified in Figure 1. (B) Substratum category loadings showing the relative contributions of each substratum to the observed differences in benthic community structure. CCA: crustose coralline algae; EAM: epilithic algal matrix.
Figure 4
Figure 4. Spatial variation in herbivorous fish biomass on Lord Howe Island.
Variation in (A) all roving herbivorous fishes, (B) macroalgal browsing fishes, and (C) grazing fishes among three habitats and five sites on Lord Howe Island. Each mean is based on six 50-m belt transects. Note the difference in the y-axis scales for the two functional groups.
Figure 5
Figure 5. Principal component analysis showing the relationships among herbivorous fish assemblages on Lord Howe Island.
(A) Ordination plot showing the relationship between fourteen locations. Each location is based on six 50-m belt transects. Symbols as for Figure 3. (B) Species loadings showing the relative contributions of each species to the observed differences in herbivorous fish community structure. Species names: Girella cyanea (Kyphosidae); Prionurus maculatus (Acanthuridae); Chlorurus sordidus, Scarus altipinnis, Scarus ghobban (Labridae).
Figure 6
Figure 6. Relationships among major benthic categories and the biomass of grazing fishes on Lord Howe Island.
Correlations between the cover of live coral and (A) the cover of macroalgae, and (B) the cover of EAM and CCA. Correlations between the density of juvenile corals and (C) the cover of macroalgae, (D) the cover of EAM and CCA, and (E) the biomass of grazing fishes. Each point represents values from individual transects (n = 84). The best-fit relationships (linear) are given as solid lines, along with r and p values.

Similar articles

Cited by

References

    1. Bellwood DR, Hughes TP, Folke C, Nyström M. Confronting the coral reef crisis. Nature. 2004;429:827–833. - PubMed
    1. Nyström M, Folke C. Spatial resilience of coral reefs. Ecosystems. 2001;4:406–417.
    1. Sheppard CRC. Predicted recurrences of coral mortality in the Indian Ocean. Nature. 2003;425:294–297. - PubMed
    1. Donner SD, Skirving WJ, Little CM, Hoegh-Guldberg O, Oppenheimer M. Global assessment of coral bleaching and required rates of adaptation under climate change. Glob Change Biol. 2005;11:2251–2265. - PubMed
    1. Hughes TP, Baird AH, Bellwood DR, Card M, Connolly SR, et al. Climate change, human impacts, and the resilience of coral reefs. Science. 2003;301:929–933. - PubMed

Publication types