. 2011;6(10):e25853.
doi: 10.1371/journal.pone.0025853. Epub 2011 Oct 3.

Betanodavirus induces oxidative stress-mediated cell death that prevented by anti-oxidants and zfcatalase in fish cells

Affiliations

Betanodavirus induces oxidative stress-mediated cell death that prevented by anti-oxidants and zfcatalase in fish cells

Chih-Wei Chang et al. PLoS One. 2011.

Abstract

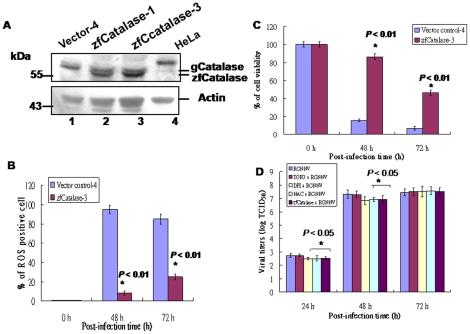
The role of oxidative stress in the pathogenesis of RNA nervous necrosis virus infection is still unknown. Red-spotted grouper nervous necrosis virus (RGNNV) induced free radical species (ROS) production at 12-24 h post-infection (pi; early replication stage) in fish GF-1 cells, and then at middle replication stage (24-48 h pi), this ROS signal may upregulate some expressions of the anti-oxidant enzymes Cu/Zn SOD and catalase, and eventually expression of the transcription factor Nrf2. Furthermore, both antioxidants diphenyliodonium and N-acetylcysteine or overexpression of zebrafish catalase in GF-1 cells also reduced ROS production and protected cells for enhancing host survival rate due to RGNNV infection. Furthermore, localization of ROS production using esterase activity and Mitotracker staining assays found that the ROS generated can affect mitochondrial morphology changes and causes ΔΨ loss, both of which can be reversed by antioxidant treatment. Taken together, our data suggest that RGNNV induced oxidative stress response for playing dual role that can initiate the host oxidative stress defense system to upregulate expression of antioxidant enzymes and induces cell death via disrupting the mitochondrial morphology and inducing ΔΨ loss, which can be reversed by anti-oxidants and zfcatalase, which provide new insight into betanodavirus-induced ROS-mediated pathogenesis.


Conflict of interest statement

Competing Interests: The authors have declared that no competing interests exist.

Figures

Figure 1
Figure 1. Identification of RGNNV infection induces ROS production in GF-1 cells.
(A) ROS production (indicated by arrows) at 0, 12, 24, 48, and 72 h pi by cells infected with RGNNV (MOI = 1). The negative control (0 h) (see e and i); 24 h negative control (see a and b); RGNNV-infected groups at 12, 24, 48, and 72 h pi (see f–m and j–n, respectively; Green fluorescent cells as the ROS production positive cells); positive control H2O2 (1 µM) at 24 h post-incubation (see c and d; Green fluorescent cells as the ROS production positive cells). Scale bar = 10 µm. (B) The percentage of ROS-producing cells was counted at 0, 12, 24, 48, and 72 h, and shows a significant increase over time. In this and all subsequent figures (unless otherwise noted) data are presented as the percentage of 200 cells at each time point determined in triplicate, with each point representing the mean of three independent experiments. The vertical bars indicate ± the standard error of the mean (SEM). All data were analyzed using either a paired or unpaired Student's t-test, as appropriate. Statistically significant was defined at P<0.01. (C) The ratios of ROS-producing cells were counted by fluorescence microplate reader at 0, 12, 24, 48, and 72 h, and showed a significant increase at 24 h pi, but not at 48 h and 72 h pi because those times left few cells in wells. *P<0.01 indicated a statistically significant difference between mean values of the groups. (D) Concentration of peroxide in medium of RGNNV-infected cells producing H2O2 ratio at 12, 24, 48, and 72 h pi, respectively. Peroxide concentration at each time point was determined in triplicate. *P<0.05.
Figure 2
Figure 2. Western blot analysis of RGNNV infection up-regulates anti-oxidant enzymes Cu/Zn SOD and catalase or transcriptional factor Nrf2 in GF-1 cells at middle replication stage.
The GF-1 cells pre-treated with antioxidants either NAC (1 mM) or DPI (30 mM) for two hours, then infected with RGNNV (MOI = 1) for different time incubations at 0, 24, 48, and 72 h pi. Samples were electrophoresed on a SDS-polyacrylamine gel and electro-blotted to a NC membrane. The NC membrane was stained with mouse monoclonal IgG antibodies directed against Cu/Zn SOD (15-kDa; Cayman), Catalase (57-kDa; Rockland), and Nrf2 (74-kDa) (Rockland). The chemiluminescent signal was imaged on XAR-5 film (Kodak) using a 5-min exposure. Lanes 1–4, 30 ul of virus-infected GF-1 cells and corresponded to 0, 24 h, 48 h and 72 h pi, respectively. The actin internal is also shown.
Figure 3
Figure 3. Influence of anti-oxidants NAC and DPI treatments on ROS production and cellular viability during RGNNV infection.
(A) The GF-1 cells pre-treated with antioxidants either NAC or DPI for two hours, then infected with RGNNV (MOI = 1) for different time incubations. The number of ROS producing cells infected with RGNNV TN1 at 0, 24, 48, and 72 h pi was assayed with the Image-iT LIVE Green Reactive Oxygen Species Detection Kit. Data are the percentage of 200 cells at each time point, determined in triplicate, with each point representing the mean of three independent experiments; error bars represent the SEM. The data were analyzed using either a paired or unpaired Student's t-test. as appropriate. *P<0.01. (B) The viability of GF-1 cells infected with RGNNV and treated with or without NAC or DPI at 0, 24, 48, and 72 h pi in triplicate by using a trypan blue dye exclusion assay . The data were analyzed using either a paired or unpaired Student's t-test. as appropriate. *P<0.05.
Figure 4
Figure 4. Identification of anti-oxidants treatment can reduce apoptotic/necrotic death of cells infected with RGNNV.
(A) Phase-contrast and fluorescent micrographs of annexin-V–stained, RGNNV-infected GF-1 cells without drug-treatment at 0 h (a and f), 24 h (b and g), 48 h (c and h), and 72 h (d and i) or with NAC-treatment at 24 h (e and j), 48 h (k and p), and 72 h (l and q) and DPA-treatment at 24 h (m and r), 48 h (n and s), and 72 h (o and t). Annexin-V–positive cells (necrotic cells) are indicated by arrows. Scale bar = 20 µm. (B) The number of annexin-V–positive cells after infection with RGNNV at 0, 24, 48, and 72 h. Statistical comparisons were made using either a paired or unpaired Student's t-test, as appropriate. *P<0.05. (C) Examples of flow cytometric profiles in 48 h pi. RGNNV-infected cell and plus anti-oxidants treatment cells PI staining fluorescence was measured from 10,000 cells. Numbers in second peak scales (PI+) show late apoptotic/secondary necrotic cell percentages respectively. Viable cell percentage (PI) is shown in first peak.
Figure 5
Figure 5. Identification of zebrafish catalase overexpression can reduce RGNNV-induced ROS-mediated cell death and viral titers in GF-1 cells.
(A) Western blot analysis of zebrafish catalase-producing cell lines in GF-1 cells after selection with Zeocin (500 µg/ml). The stable clones are zfCatalase-1 (lane 2), zfCatalase-3 (lane 3), and vector control-4 (lane 1). HeLa cell lysate serves as a positive control (lane 4). Actin used as an internal loading control. (B) The number of ROS-producing cells after infection with RGNNV (MOI = 1) at 0, 48, and 72 h. Statistical comparisons were made using either a paired or unpaired Student's t-test, as appropriate. *P<0.01. (C) The viability of cells transfected with vector control-4 or zfcatalase-3 and infected with RGNNV was determined at 0, 48, and 72 h pi in triplicate by using a trypan blue dye exclusion assay . Statistical comparisons were made using either a paired or unpaired Student's t-test, as appropriate. *P<0.01. (D) Viral titers were assays in GF-1 cell line by using at 48 h and 72 h pi samples. Statistical comparisons were made using either a paired or unpaired Student's t-test, as appropriate. *P<0.05.
Figure 6
Figure 6. Identification of RGNNV-induced ROS production and the effect of ROS on mitochondrial morphology and loss of ΔΨ in GF-1 cells.
Phase-contrast and fluorescence micrographs showing ROS production (the Image-iT LIVE Green Reactive Oxygen Species Detection Kit) and mitochondrial morphology (stained by Mito tracker) were in the same cells. (A) RGNNV-infected GF-1 cells at 0 h (a–d), 24 h (e–h; ROS produced in cells, and 48 h (i–l). The elongated mitochondrial network at 0 h in A:d is indicated by arrow in A:p. ROS production at 0 h in A:m is indicated in open square in A:b; at 24 h pi in A:n and p is indicated open square in A:f and h; at 48 h pi in A:o and r is indicated in open square in A:j and l. Breakdown of mitochondrial fission (indicated by arrows) at 48 h pi in A:r is indicated open square in A:l. Scale bar = 10 µm. (B) RGNNV-infected GF-1 cells treated with NAC at 24 h (e–h) and 48 h pi (m–p), or not treated at 24 h (a–d) and 48 h pi (i–l) with RGNNV infection. Blockade of mitochondrial breakdown in RGNNV-infected GF-1 cells at 48 h pi in B:p is indicated open square in B:l, which were appeared some dot of mitochondria and indicated by arrow; without RGNNV-infected cells at 48 h pi in B:r is indicated open square in B:p, which have shown more longer mitochondria in length that indicated by arrow. Scale bar = 10 µm. (C) The effect of anti-oxidants NAC and DPI on ΔΨ in cells infected with RGNNV. The ΔΨ (MMP loss) of RGNNV-infected GF-1 cells treated or not treated with NAC or DPI was determined at 0, 24, 48, and 72 h pi in triplicate. Statistical comparisons were made using either a paired or unpaired Student's t-test, as appropriate. *P<0.05.
Figure 7
Figure 7. A schematic illustrating our hypothesis of RGNNV infection induced ROS-mediated cell death.
RGNNV first can enter and express viral early gene at early replication stage [0–24 h pi; initiation of oxidative stress response (OSR) stage], then induces ROS production apparently in mitochondria and initiates oxidative stress responses. Furthermore, at middle replication stage (24–48 h pi; OSR stage), oxidative stress responses are dramatically (1) up-regulating the antioxidants enzymes Cu/Zn SOD and catalase, (2) affecting the viral replication for mild increasing virus titer and (3) eventually producing mitochondrial breakdown as a fission action. Finally, cells undergo a ROS-mitochondria-mediated cell death at late replication stage (at 48 h-72 h pi; disruption stage). RGNNV-induced death signaling is halted by anti-oxidants DPI and NAC or anti-oxidant enzyme zfCatalase over-expression (a) for reducing ROS production and enhancing cell viability.

Similar articles

Cited by

References

    1. Ball L, Johnson K. Reverse genetics of nodaviruses. Adv Virus Res. 1999;53:229–244. - PubMed
    1. Bovo G, Nishizawa T, Maltese C, Borghesan F, Mutinelli F, et al. Viral encephalopathy and retinopathy of farmed marine fish species in Italy. Virus Res. 1999;63:143–146. - PubMed
    1. Johnson K, Zeddam J, Ball L. Characterization and construction of functional cDNA clones of Pariacoto virus, the first Alphanodavirus isolated outside Australasia. J Virol. 2000;74:5123–5132. - PMC - PubMed
    1. Munday B, Kwang J, Moody N. Betanodavirus infections of teleost fish: a review. J Fish Dis. 2002;25:127–142.
    1. Schneemann A, Reddy V, Johnson J. The structure and function of nodavirus particles: a paradigm for understanding chemical biology. Adv Virus Res. 1998;50:381–446. - PubMed

Publication types

MeSH terms