. 2011 Sep 1;2(9):2517-31.
doi: 10.1364/BOE.2.002517. Epub 2011 Aug 2.

Effects of incomplete decay in fluorescence lifetime estimation

Effects of incomplete decay in fluorescence lifetime estimation

Regina Won Kay Leung et al. Biomed Opt Express. .

Abstract

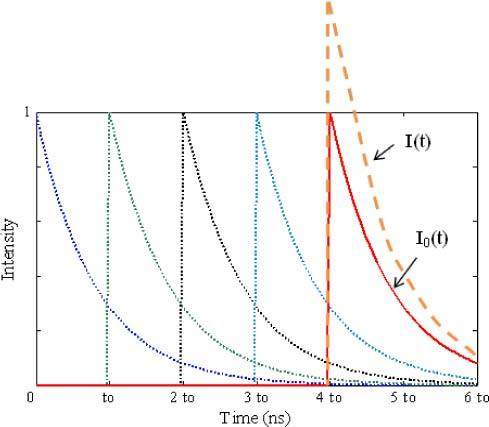
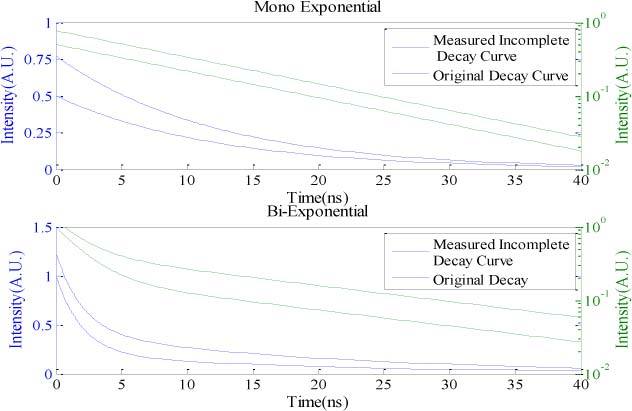
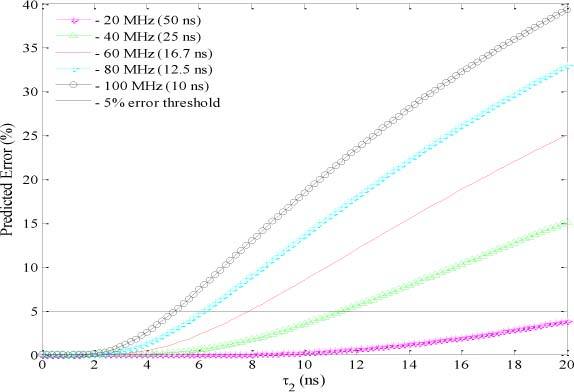
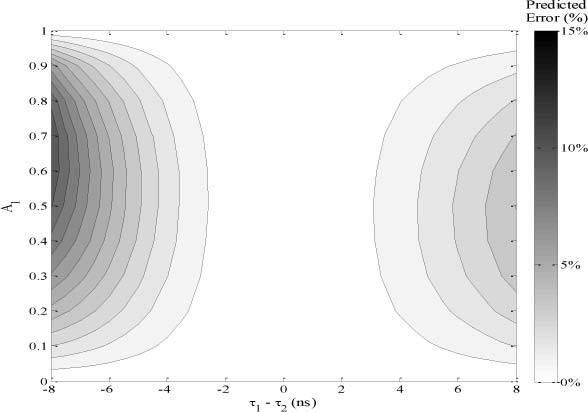
Fluorescence lifetime imaging has emerged as an important microscopy technique, where high repetition rate lasers are the primary light sources. As fluorescence lifetime becomes comparable to intervals between consecutive excitation pulses, incomplete fluorescence decay from previous pulses can superimpose onto the subsequent decay measurements. Using a mathematical model, the incomplete decay effect has been shown to lead to overestimation of the amplitude average lifetime except in mono-exponential decays. An inverse model is then developed to correct the error from this effect and the theoretical simulations are tested by experimental results.

Keywords: (170.3650) Lifetime-based sensing; 180.2520 Fluorescence microscopy.


Figures

Fig. 1
Fig. 1
Simulated effect of incomplete decay on the measured decay curve is illustrated, where the tails of multiple previous decay curves (short dashed lines) excited by a high repetition rate light source contribute significantly to the current original curve, I0(t)(solid line), which lead to the distorted measured decay curve, I(t) (long dashed line) that can cause inaccurate lifetime estimation. t0 is the time interval between two consecutive excitation pulses. Note that the incomplete decay caused by the laser excitation prior to the current one contributes the most to the current measured decay curve as illustrated in the last decay curve.
Fig. 2
Fig. 2
Simulation of the original (solid line) and measured (dashed line) decay curves for both mono-exponential (top) and bi-exponential (bottom) cases at repetition rate of 80 MHz (12.5 ns). For the mono-exponential case, τ01 = 12 ns, A01 = 0.5. For the bi-exponential case, τ 01 = 2 ns, τ02 = 20 ns, A01 = 0.8, A02 = 0.2. The corresponding log scale plots of each decay curve are also shown as the top two curves of each graph with the log plot axis on the right.
Fig. 3
Fig. 3
The predicted fractional errors defined by Eq. (12) are plotted as a result of incomplete decay at various original amplitude weighted lifetime values at various repetition rates for bi-exponential decays. For each curve, τ1 remains constant at 1 ns and τ2 is varied from 0 to 20 ns as shown on the x-axis. The coefficients are fixed at Ao1 = Ao2 = 0.5.
Fig. 4
Fig. 4
– Illustrating the dependence and trends of absolute fractional error (as defined in Eq. (16) on measured coefficient and lifetime component values using a contour plot. Y-axis corresponds to A1 and is varied from 0 to 1 (A2 = 1 – A1). X-axis corresponds to the difference between measured lifetime components (τ1 – τ2) where τ2 (10 ns) was chosen to be constant and τ1 varies from τ28(2 ns) to τ2 + 8 (18 ns). The varying gray scale color of the contour map corresponds to the calculated absolute fractional errors where the larger the error, the darker the gray scale color as defined by the color bar.

Similar articles

Cited by

References

    1. Suhling K., French P. M., Phillips D., “Time-resolved fluorescence microscopy,” Photochem. Photobiol. Sci. 4(1), 13–22 (2005).10.1039/b412924p - DOI - PubMed
    1. Kelleher M. T., Fruhwirth G., Patel G., Ofo E., Festy F., Barber P. R., Ameer-Beg S. M., Vojnovic B., Gillett C., Coolen A., Kéri G., Ellis P. A., Ng T., “The potential of optical proteomic technologies to individualize prognosis and guide rational treatment for cancer patients,” Target Oncol 4(3), 235–252 (2009).10.1007/s11523-009-0116-y - DOI - PMC - PubMed
    1. Munro I., McGinty J., Galletly N., Requejo-Isidro J., Lanigan P. M. P., Elson D. S., Dunsby C., Neil M. A. A., Lever M. J., Stamp G. W. H., French P. M. W., “Toward the clinical application of time-domain fluorescence lifetime imaging,” J. Biomed. Opt. 10(5), 051403 (2005).10.1117/1.2102807 - DOI - PubMed
    1. J. R. Lakowicz, Principles of Fluorescence Spectroscopy, 3rd ed. (Kluwer Academic/Plenum, New York, 2006), Chap. 4.
    1. Fruhwirth G. O., Ameer-Beg S., Cook R., Watson T., Ng T., Festy F., “Fluorescence lifetime endoscopy using TCSPC for the measurement of FRET in live cells,” Opt. Express 18(11), 11148–11158 (2010).10.1364/OE.18.011148 - DOI - PMC - PubMed

LinkOut - more resources