. 2011 Sep 1;2(9):2679-89.
doi: 10.1364/BOE.2.002679. Epub 2011 Aug 23.

Non-thermal effects of terahertz radiation on gene expression in mouse stem cells

Non-thermal effects of terahertz radiation on gene expression in mouse stem cells

Boian S Alexandrov et al. Biomed Opt Express. .

Abstract

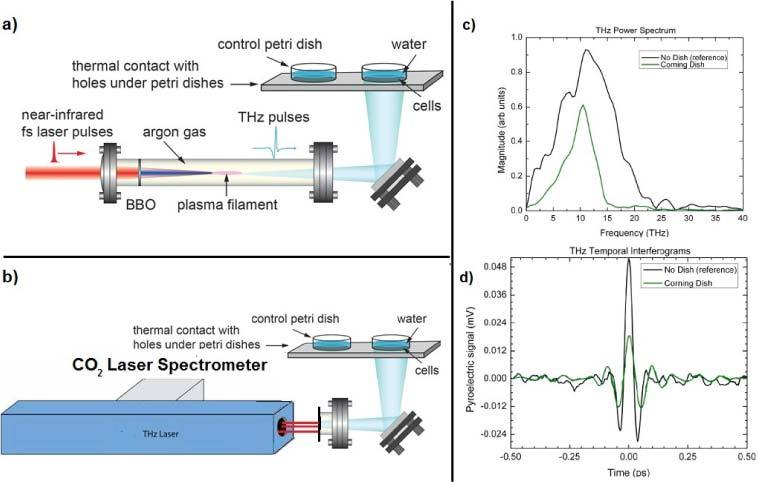
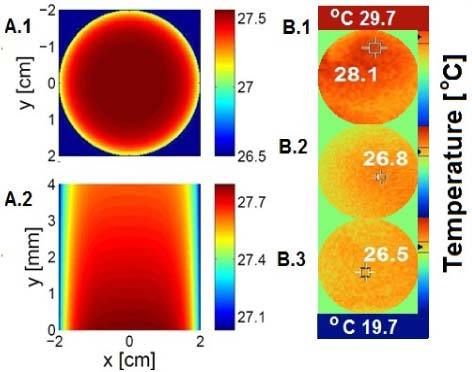
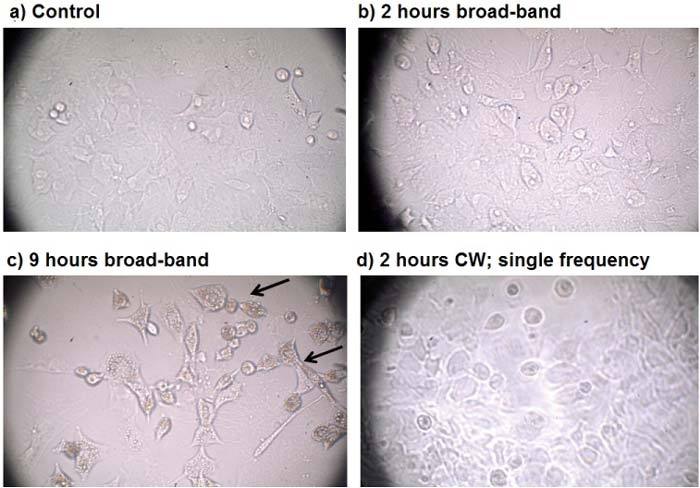
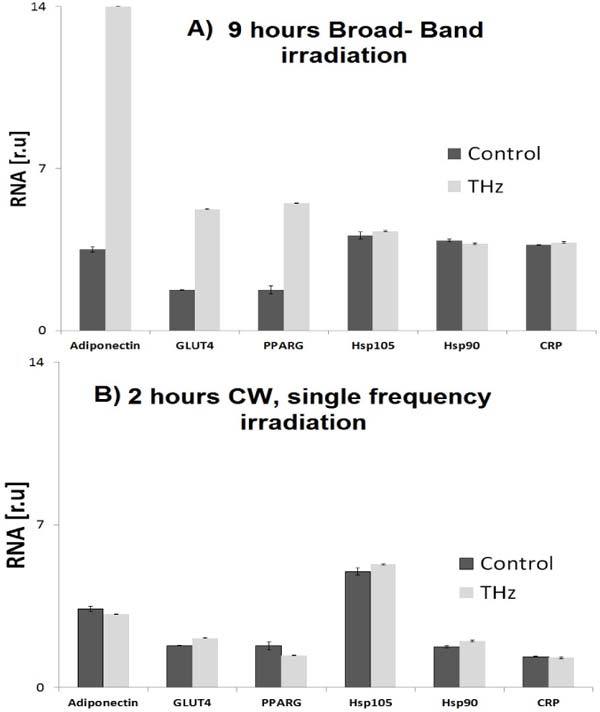
In recent years, terahertz radiation sources are increasingly being exploited in military and civil applications. However, only a few studies have so far been conducted to examine the biological effects associated with terahertz radiation. In this study, we evaluated the cellular response of mesenchymal mouse stem cells exposed to THz radiation. We apply low-power radiation from both a pulsed broad-band (centered at 10 THz) source and from a CW laser (2.52 THz) source. Modeling, empirical characterization, and monitoring techniques were applied to minimize the impact of radiation-induced increases in temperature. qRT-PCR was used to evaluate changes in the transcriptional activity of selected hyperthermic genes. We found that temperature increases were minimal, and that the differential expression of the investigated heat shock proteins (HSP105, HSP90, and CPR) was unaffected, while the expression of certain other genes (Adiponectin, GLUT4, and PPARG) showed clear effects of the THz irradiation after prolonged, broad-band exposure.

Keywords: (170.1420) Biology; (170.1530) Cell analysis; (170.7160) Ultrafast technology.


Figures

Fig. 1
Fig. 1
Schematic representation of the experimental setups: a) Pulsed broad–band source; b) CW laser source; c) Power spectrum of the broad-band source, with and without petri dish; d) The temporal interferograms of the broad-band source, with and without petri dish.
Fig. 2
Fig. 2
Calculated thermal profiles: A.1 shows the top view of the steady state thermal profile in the presence of irradiation from the laser source. A.2 shows the side view of the steady state thermal profile in the presence of irradiation from the laser source. Cells are positioned at the dish bottom (z = 0). B). Measured (by IR detector) thermal profiles: B.1 represent a top view snapshot of the petri dish after 2 hours of irradiation from the CW laser source. B.2 represent top view snapshot after 2 hours of irradiation from the broad-band source. B.3 represent top view snapshot of non-irradiated (control) petri dish. All the cell cultures were thermoequilibrated slightly above the ambient room temperature (panel B.3).
Fig. 3
Fig. 3
Light microscopy image: a) Control cultures; Mouse stem cells after: 2 hours - b) and 9 hours - c), of pulsed broad-band irradiation; d) Mouse stem cells after 2 hours of irradiation from the CW laser source. The arrows in c) indicate cells with an elevated number of lipid droplets inclusions.
Fig. 4
Fig. 4
A) Comparison between the differential gene expression of the heat shock proteins Hsp105, Hsp90, and the C-reactive protein (CRP) and previously reported [29] up-regulated genes in response to 9 hours of exposure from the broad-band source. B) Differential gene expression of the heat shock proteins Hsp105, Hsp90, and the C-reactive protein (CRP) together with the differential expression of GLUT4, Adiponectin and PPARG in response to 2 hours of exposure from the CW source. Expression levels are normalized to the expression level of the TBP gene, as in Ref. [29]. The identities of the genes are given below the X-axes. Light grey bars: THz exposed cells, Dark grey bars: control cells. The number of specific transcripts is shown on the vertical axis in relative units [r.u.]. The experimental results are consistent between three independent qRT-PCR measurements in duplicates (the standard deviation is shown with errors bars) and in two different sets of irradiation.

References

    1. Woodward R. M., Cole B. E., Wallace V. P., Pye R. J., Arnone D. D., Linfield E. H., Pepper M., “Terahertz pulse imaging in reflection geometry of human skin cancer and skin tissue,” Phys. Med. Biol. 47(21), 3853–3863 (2002).10.1088/0031-9155/47/21/325 - DOI - PubMed
    1. Oh S. J., Kang J., Maeng I., Suh J. S., Huh Y. M., Haam S., Son J. H., “Nanoparticle-enabled terahertz imaging for cancer diagnosis,” Opt. Express 17(5), 3469–3475 (2009).10.1364/OE.17.003469 - DOI - PubMed
    1. Wallace V. P., Fitzgerald A. J., Shankar S., Flanagan N., Pye R., Cluff J., Arnone D. D., “Terahertz pulsed imaging of basal cell carcinoma ex vivo and in vivo,” Br. J. Dermatol. 151(2), 424–432 (2004).10.1111/j.1365-2133.2004.06129.x - DOI - PubMed
    1. Appleby R., Wallace H. B., “Standoff detection of weapons and contraband in the 100 GHz to 1 THz region,” IEEE Trans. Antenn. Propag. 55(11), 2944–2956 (2007).10.1109/TAP.2007.908543 - DOI
    1. Federici J. F., Schulkin B., Huang F., Gary D., Barat R., Oliveira F., Zimdars D., “THz imaging and sensing for security applications: explosives, weapons and drugs,” Semicond. Sci. Technol. 20(7), S266–S280 (2005).10.1088/0268-1242/20/7/018 - DOI

LinkOut - more resources