. 2011 Oct 12:12:395.
doi: 10.1186/1471-2105-12-395.

Phamerator: a bioinformatic tool for comparative bacteriophage genomics

Affiliations

Phamerator: a bioinformatic tool for comparative bacteriophage genomics

Steven G Cresawn et al. BMC Bioinformatics. .

Abstract

Background: Bacteriophage genomes have mosaic architectures and are replete with small open reading frames of unknown function, presenting challenges in their annotation, comparative analysis, and representation.

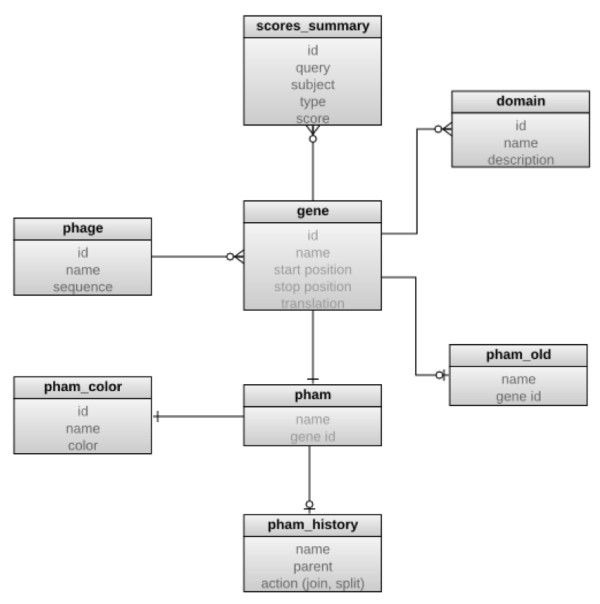
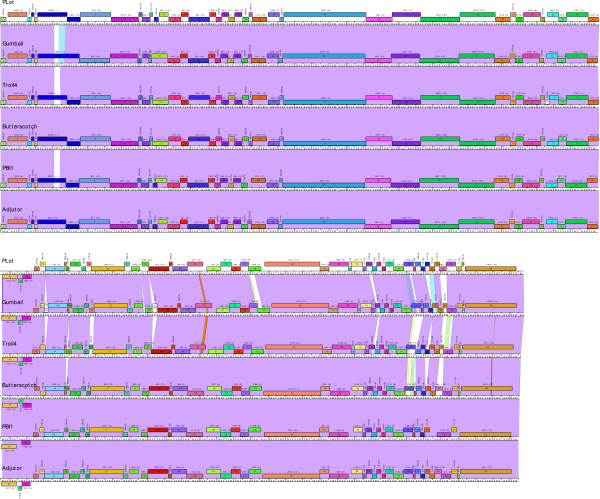
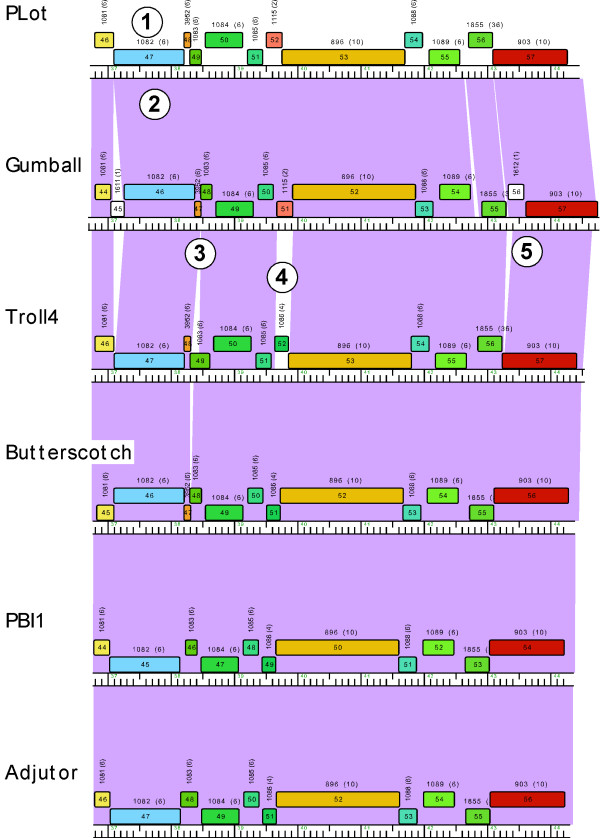
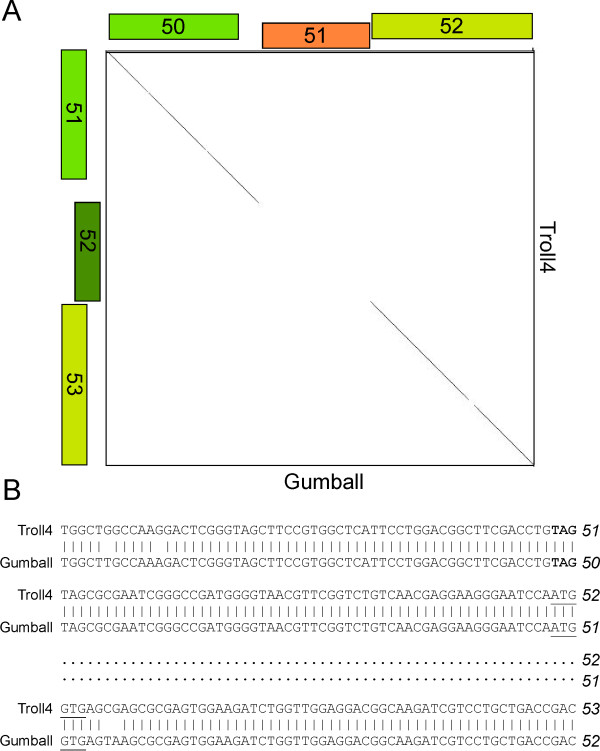
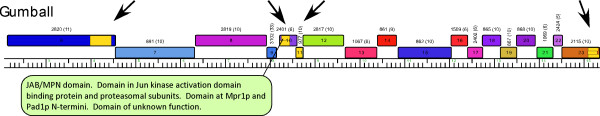
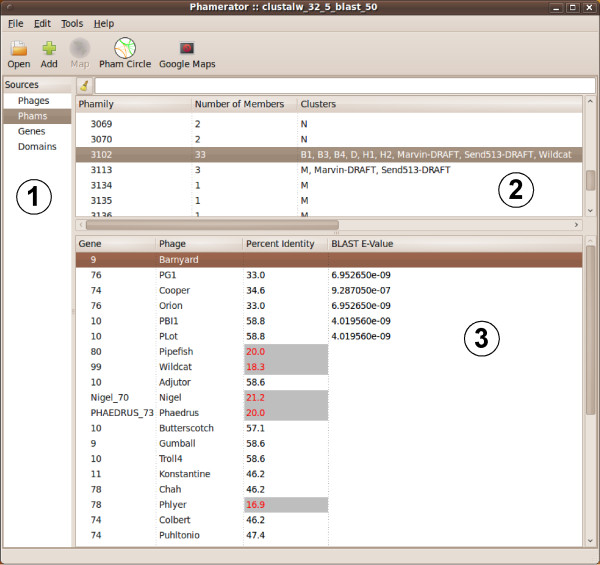
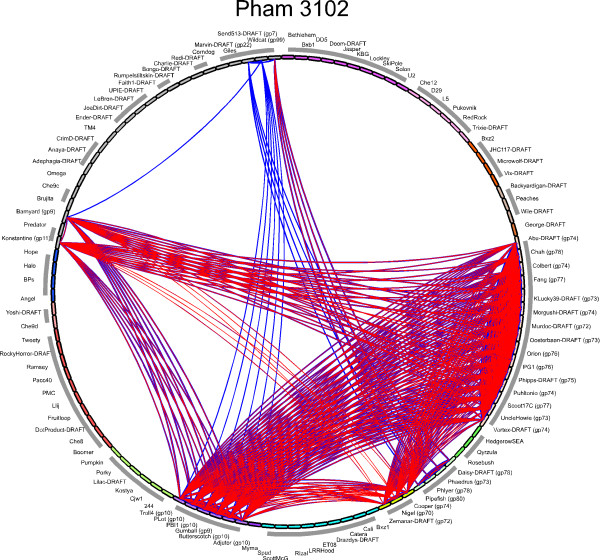
Results: We describe here a bioinformatic tool, Phamerator, that assorts protein-coding genes into phamilies of related sequences using pairwise comparisons to generate a database of gene relationships. This database is used to generate genome maps of multiple phages that incorporate nucleotide and amino acid sequence relationships, as well as genes containing conserved domains. Phamerator also generates phamily circle representations of gene phamilies, facilitating analysis of the different evolutionary histories of individual genes that migrate through phage populations by horizontal genetic exchange.

Conclusions: Phamerator represents a useful tool for comparative genomic analysis and comparative representations of bacteriophage genomes.


Figures

Figure 1
Figure 1
Database structure. An entity relationship diagram of the Phamerator database schema. Boxes represent SQL database tables, with table names in bold and column names in gray. The gene is the central element of the design, with the domain and pham tables storing data related to individual genes. The pham_history and pham_old tables record information regarding the automatic joining or splitting of phams as genomes are added or removed from the database.
Figure 2
Figure 2
Effects of CLUSTALW and BLASTP thresholds on pham assembly. A. Changes in the total number of phams, number of orphams, and maximum pham size as a function of CLUSTALW threshold (percent identity). B. Changes in the percent of total phams that are orphams and mean pham size as a function of CLUSTALW threshold (percent identity). C. Changes in the total number of phams, number of orphams, and maximum pham size as a function of BLASTP threshold (E-value), superimposed over a CLUSTALW cutoff value of 32.5% identity. D. Change in the mean pham size as a function of BLASTP threshold (E-value), superimposed over a CLUSTALW cutoff value of 32.5% identity.
Figure 3
Figure 3
Phamerator-generated genome maps. A. Genome maps of six Cluster D phages (Plot, Gumball, Troll4, Butterscotch, PBI1 and Adjutor). The genomes are shown in two tiers. Genes are color-coded according to their pham assignment. Gene numbers are shown within each gene box, and the pham number and number of pham members in parentheses shown above each gene. Pairwise nucleotide sequence similarities are presented as colored shading between genomes; color spectrum reflects the extent of nucleotide sequence similarities with violet being the most similar and red being the least similar. No shading shows that there is no similarity with a BLASTN score of 10-4 or better.
Figure 4
Figure 4
Expanded view of Cluster D genome maps. Five specific features are indicated. Feature #1 shows the designation of the pham assignment (Pham1082) for Plot gene 47, and that Pham1082 contains six members (shown in parentheses). The six genomes shown all contain a member of Pham1082, and thus there are no other members of Pham1082 outside of Cluster D. Feature #2 shows the violet shading between Plot and Gumball genomes, reflecting a high degree of nucleotide sequence similarity. Feature #3 illustrates a departure in the synteny of phages Gumball and Troll4, with an apparent insertion within Troll4 gene 49, relative to Gumball gene 48, both of which are in Pham1083. Feature #4 indicates a replacement of Gumball gene 51 for the Troll4 gene 52, reflected in the lack of nucleotide similarity and the designation of the genes in two different phams (Pham1115 and Pham1086 respectively). Note that PLot shares a member of Pham1115 and Butterscotch, PBI1 and Adjutor share members of Pham1086. Feature #5 shows a small insertion in Gumball relative to Troll4 (as well as Butterscotch, PBI1 and Adjutor) that leads to an alternative annotation of this genome segment, with inclusion of a putative new orpham (Gumball gene 56) and shorter version of Gumball gene 57.
Figure 5
Figure 5
Lack of nucleotide similarity between Gumball gene 51 and Troll4 gene 21. A. Dotplot comparison of Gumball genes 50-52 and Troll4 genes 51-53 (see feature #4 in Figure 4). B. Alignment of DNA segments of Troll4 and Gumball shows that the boundary of sequence identity and non-identity occurs precisely at the beginnings of Troll4 gene 52 and Gumball gene 51 (the ATG start codons are underlined) and the beginnings of Troll4 gene 53 and Gumball gene 52 (GTG start codons are underlined).
Figure 6
Figure 6
Representations of conserved domains. A segment of the Gumball genome is displayed while using the Show Conserved Domains functions in Phamerator. Within the gene 6 - 23 region there are four genes (arrowed) for which conserved domains are displayed, shown as yellow boxes. In genes 6 and 11, only a single domain is identified, whereas in genes 10 and 23, two and three domains are displayed. These correspond to the same parts of the proteins and therefore reflect redundancy in the CDD database. Holding the mouse over a domain activates a pop-up displaying the domain information, illustrated for a domain in gene 10.
Figure 7
Figure 7
The Phamily display function of Phamerator. A screen-shot of the main Phamerator display shows four sources listed in the left-hand panel (feature #1). When the Phams function is selected, a list of all of the phamilies, the numbers of members, and the clusters to which the parent genomes belong are displayed in the top right panel (feature #2). When a particular pham is selected (Pham3102 is shown), the gene members, the parent phages, and the percent identities and BLASTP E-values are shown in the bottom right panel. When a specific gene is selected (Barnyard gene 9 is shown; feature #3), the percent identity and BLASTP E-values displayed are in reference to the selected gene. The values in red and gray-highlighted are below the threshold values for pham assembly.
Figure 8
Figure 8
The Phamily circle representation function. When the Pham Circle function is chosen (shown in the very top panel in Figure 7), a phamily circle is drawn in which all of the component phages in the dataset are represented around the circumference of a circle, ordered according to their cluster and subcluster designations. An arc is drawn between members of that pham that are related to each other above the threshold values; blue and red arcs show CLUSTALW and BLASTP matches respectively. Some of the relationships only report BLASTP scores, such as the blue arcs between PLot and Send513, and others only CLUSTAL score such as the red arcs between Konstantine and Nigel. Most show red and blue arcs superimposed. Arc widths reflect the strengths of the relationships.
Figure 9
Figure 9
Distributions of pham sizes. A. The proportions of phams containing a single member (i.e. orphams), two members, or more - as indicated by the white numbers - are represented as a pie chart. B. A segment of the genome of the singleton phage Wildcat shows the abundance of small genes of which many - shown as white boxes - are orphams.

References

    1. Hatfull GF. Bacteriophage genomics. Curr Opin Microbiol. 2008;11(5):447–453. doi: 10.1016/j.mib.2008.09.004. - DOI - PMC - PubMed
    1. Suttle CA. Viruses in the sea. Nature. 2005;437(7057):356–361. doi: 10.1038/nature04160. - DOI - PubMed
    1. Suttle CA, Chan AM. Dynamics and distribution of cyanophages and their effect on marine Synechococcus spp. Appl Environ Microbiol. 1994;60:3167–3174. - PMC - PubMed
    1. Hatfull GF, Pedulla ML, Jacobs-Sera D, Cichon PM, Foley A, Ford ME, Gonda RM, Houtz JM, Hryckowian AJ, Kelchner VA, Namburi S, Pajcini KV, Popovich MG, Schleicher DT, Simanek BZ, Smith AL, Zdanowicz GM, Kumar V, Peebles CL, Jacobs WR Jr, Lawrence JG, Hendrix RW. Exploring the mycobacteriophage metaproteome: phage genomics as an educational platform. PLoS Genet. 2006;2(6):e92. doi: 10.1371/journal.pgen.0020092. - DOI - PMC - PubMed
    1. Hanauer DI, Jacobs-Sera D, Pedulla ML, Cresawn SG, Hendrix RW, Hatfull GF. Inquiry learning. Teaching scientific inquiry. Science. 2006;314(5807):1880–1881. doi: 10.1126/science.1136796. - DOI - PubMed

Publication types

LinkOut - more resources