. 2011;12 Suppl 4(Suppl 4):S3.
doi: 10.1186/1471-2105-12-S4-S3. Epub 2011 Jul 5.

Improving the prediction of disease-related variants using protein three-dimensional structure

Affiliations

Improving the prediction of disease-related variants using protein three-dimensional structure

Emidio Capriotti et al. BMC Bioinformatics. 2011.

Abstract

Background: Single Nucleotide Polymorphisms (SNPs) are an important source of human genome variability. Non-synonymous SNPs occurring in coding regions result in single amino acid polymorphisms (SAPs) that may affect protein function and lead to pathology. Several methods attempt to estimate the impact of SAPs using different sources of information. Although sequence-based predictors have shown good performance, the quality of these predictions can be further improved by introducing new features derived from three-dimensional protein structures.

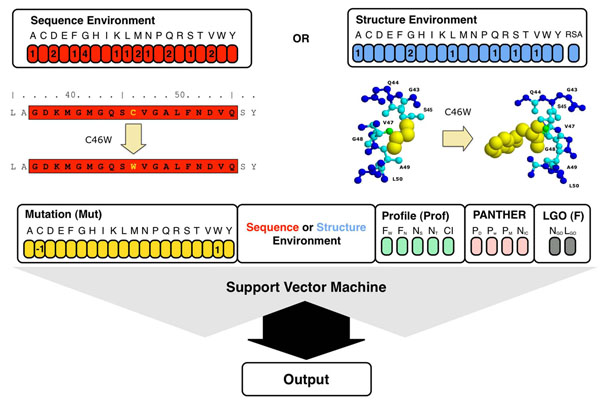
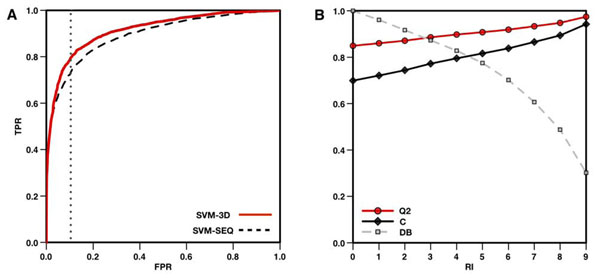
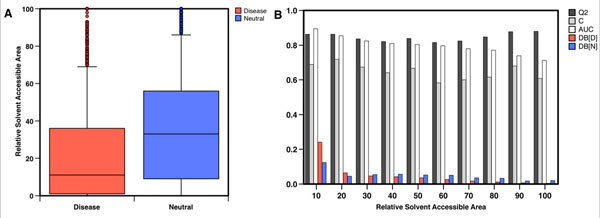
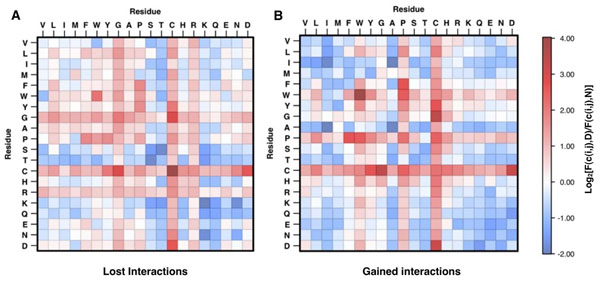
Results: In this paper, we present a structure-based machine learning approach for predicting disease-related SAPs. We have trained a Support Vector Machine (SVM) on a set of 3,342 disease-related mutations and 1,644 neutral polymorphisms from 784 protein chains. We use SVM input features derived from the protein's sequence, structure, and function. After dataset balancing, the structure-based method (SVM-3D) reaches an overall accuracy of 85%, a correlation coefficient of 0.70, and an area under the receiving operating characteristic curve (AUC) of 0.92. When compared with a similar sequence-based predictor, SVM-3D results in an increase of the overall accuracy and AUC by 3%, and correlation coefficient by 0.06. The robustness of this improvement has been tested on different datasets and in all the cases SVM-3D performs better than previously developed methods even when compared with PolyPhen2, which explicitly considers in input protein structure information.

Conclusion: This work demonstrates that structural information can increase the accuracy of disease-related SAPs identification. Our results also quantify the magnitude of improvement on a large dataset. This improvement is in agreement with previously observed results, where structure information enhanced the prediction of protein stability changes upon mutation. Although the structural information contained in the Protein Data Bank is limiting the application and the performance of our structure-based method, we expect that SVM-3D will result in higher accuracy when more structural date become available.


Figures

Figure 1
Figure 1
Flow chart of our SVM-based methods. The structure-based method (SVM-3D) takes in input mutation (yellow) structure environment (in blue), sequence profile (green), PANTHER output (pink) and function (gray) information. In the sequence-based method (SVM-SEQ) the 21 elements vector encoding for the structural environment is replaced by the 20 elements vector encoding for the sequence environment. The structure environment is the residue composition in a 6 Å radius shell around the C-a of the mutated residue. The sequence environment is the amino acid composition window of 19 residues centred on the mutated residue.
Figure 2
Figure 2
Performance of the structural-based method. In panel (A), ROC curves of the sequence (SVM-SEQ) and structure-based methods (SVM-3D). The plot shows the improvement of 3% in AUC and 7% in TPR when sequence and structure base methods are compared. In panel B, accuracy and correlation coefficient of SVM-3D as function of the Reliability Index (RI). If predictions with RI>5 are selected the SVM-3D method results in 91% overall accuracy 0.82 correlation coefficient over 78% of the dataset. Accuracy measures (Q2, C, TPR and FPR) are defined in Methods section. DB is the fraction of the whole dataset of mutations.
Figure 3
Figure 3
Analysis of the protein three-dimensional structure environment. In panel (A) the distribution of the relative solvent accessible area (RSA) for disease-related and neutral variants. The significant difference of their distributions makes the RSA a good feature to discriminate between disease-related and neutral variants. In panel (B) we report the accuracy of SVM-3D predictions as a function of the RSA. The plot shows that the accuracy of SVM-3D is lower in exposed regions with respect to buried ones. Accuracy measures (Q2, C and AUC) are defined in Methods section. DB is the fraction of the whole dataset for disease-related (D) and neutral (N) mutations.
Figure 4
Figure 4
Log-odd score for lost residues interactions (A) and for gained interactions (B). The red and blue zones correspond to damaging and neutral interactions respectively. The mutations resulting in the lost of a Cys-Cys and the gain of Trp-Trp interactions are mainly associated to insurgence of disease.
Figure 5
Figure 5
Structure of the Glycosylasparaginase (PDB code 1APY chain A) and details of the region around Cys163 (in blue). Residues in cyan and Cys179 (yellow) are below 6 Å. Residues 163 and 179 are numbered respectively 140 and 159 in the PDB file.
Figure 6
Figure 6
Structure of the Thyroid hormone receptor (PDB code 1NAX chain A) and details of the region around the Arg243 (blue). Residues in cyan and Trp239 (yellow) are below 6 Å.

Similar articles

Cited by

References

    1. International Human Genome Sequencing Consortium. Finishing the euchromatic sequence of the human genome. Nature. 2004;431(7011):931–945. doi: 10.1038/nature03001. - DOI - PubMed
    1. HapMap Consortium. A haplotype map of the human genome. Nature. 2005;437(7063):1299–1320. doi: 10.1038/nature04226. - DOI - PMC - PubMed
    1. Cotton RG, Auerbach AD, Axton M, Barash CI, Berkovic SF, Brookes AJ, Burn J, Cutting G, den Dunnen JT, Flicek P. et al.GENETICS. The Human Variome Project. Science. 2008;322(5903):861–862. doi: 10.1126/science.1167363. - DOI - PMC - PubMed
    1. Sherry ST, Ward MH, Kholodov M, Baker J, Phan L, Smigielski EM, Sirotkin K. dbSNP: the NCBI database of genetic variation. Nucleic Acids Res. 2001;29(1):308–311. doi: 10.1093/nar/29.1.308. - DOI - PMC - PubMed
    1. Cargill M, Altshuler D, Ireland J, Sklar P, Ardlie K, Patil N, Shaw N, Lane CR, Lim EP, Kalyanaraman N. et al.Characterization of single-nucleotide polymorphisms in coding regions of human genes. Nat Genet. 1999;22(3):231–238. doi: 10.1038/10290. - DOI - PubMed

Publication types

LinkOut - more resources