. 2011 Oct;38(10):5370-84.
doi: 10.1118/1.3633899.

Fast plaque burden assessment of the femoral artery using 3D black-blood MRI and automated segmentation

Affiliations

Fast plaque burden assessment of the femoral artery using 3D black-blood MRI and automated segmentation

Bernard Chiu et al. Med Phys. 2011 Oct.

Abstract

Purpose: Vessel wall imaging techniques have been introduced to assess the burden of peripheral arterial disease (PAD) in terms of vessel wall thickness, area or volume. Recent advances in a 3D black-blood MRI sequence known as the 3D motion-sensitized driven equilibrium (MSDE) prepared rapid gradient echo sequence (3D MERGE) have allowed the acquisition of vessel wall images with up to 50 cm coverage, facilitating noninvasive and detailed assessment of PAD. This work introduces an algorithm that combines 2D slice-based segmentation and 3D user editing to allow for efficient plaque burden analysis of the femoral artery images acquired using 3D MERGE.

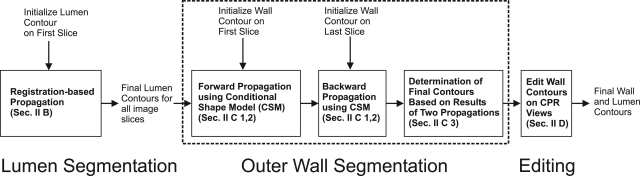
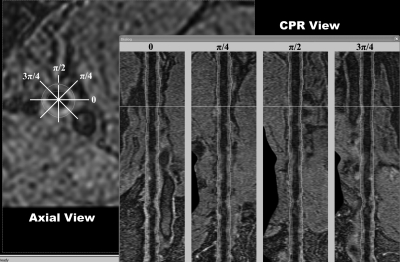
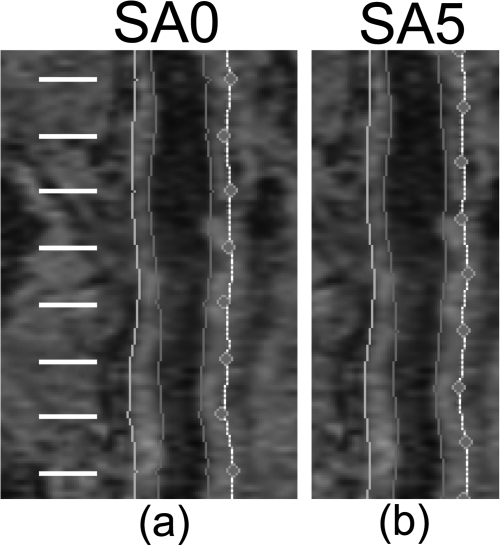
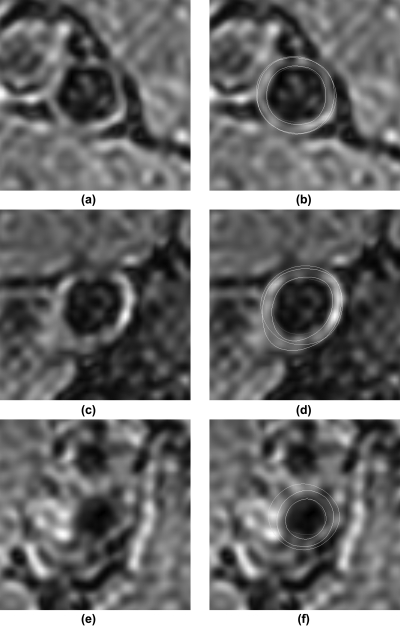
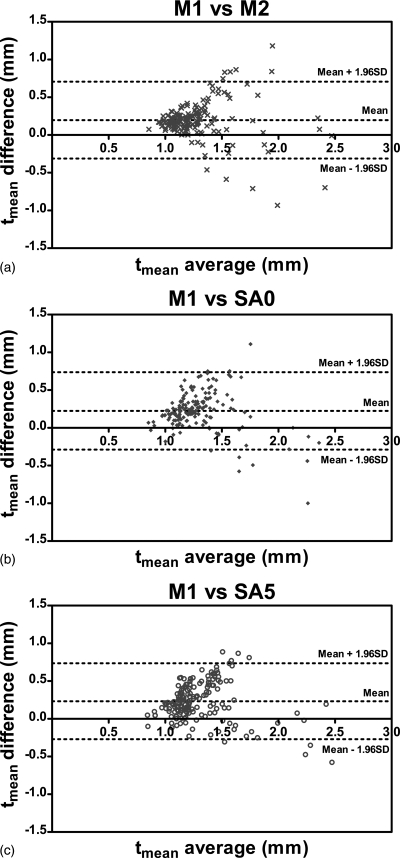
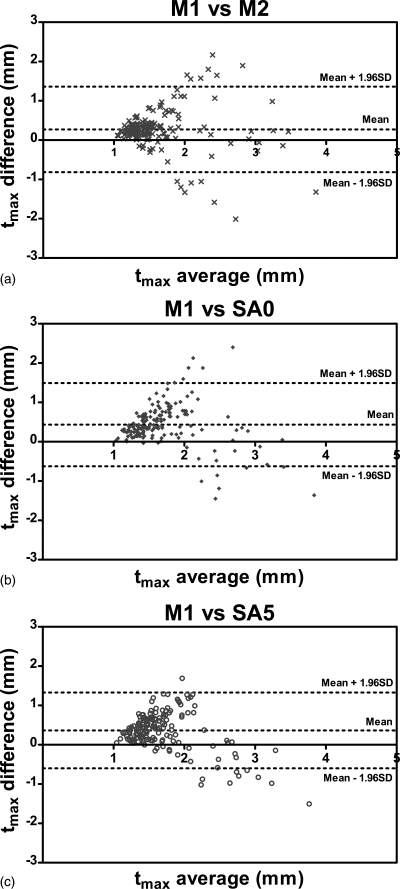
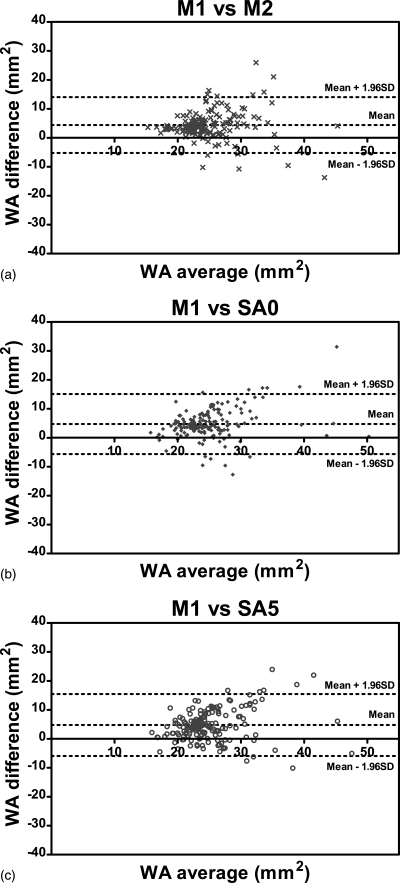
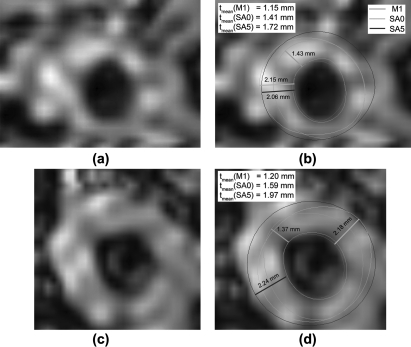
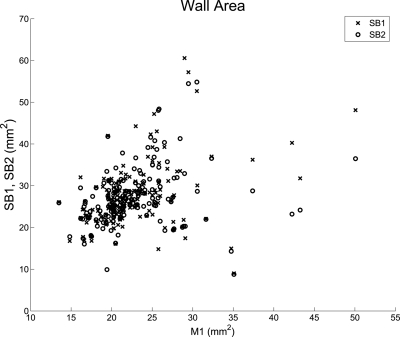
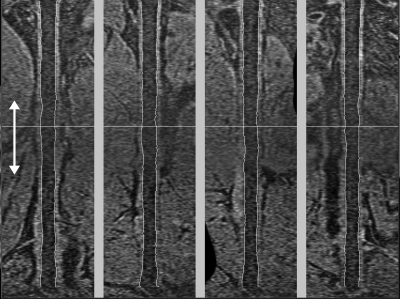
Methods: The 2D slice-based segmentation approach is based on propagating segmentation results of contiguous 2D slices. The 3D image volume was then reformatted using the curved planar reformation (CPR) technique. User editing of the segmented contours was performed on the CPR views taken at different angles. The method was evaluated on six femoral artery images. Vessel wall thickness and area obtained before and after editing on the CPR views were assessed by comparison with manual segmentation. Difference between semiautomatically and manually segmented contours were compared with the difference of the corresponding measurements between two repeated manual segmentations.

Results: The root-mean-square (RMS) errors of the mean wall thickness (t(mean)) and the wall area (WA) of the edited contours were 0.35 mm and 7.1 mm(2), respectively, which are close to the RMS difference between two repeated manual segmentations (RMSE: 0.33 mm in t(mean), 6.6 mm(2) in WA). The time required for the entire semiautomated segmentation process was only 1%-2% of the time required for manual segmentation.

Conclusions: The difference between the boundaries generated by the proposed algorithm and the manually segmented boundary is close to the difference between repeated manual segmentations. The proposed method provides accurate plaque burden measurements, while considerably reducing the analysis time compared to manual review.


Figures

Figure 1
Figure 1
Schematic diagram for the proposed semiautomatic segmentation algorithm.
Figure 2
Figure 2
Illustration of the final contour determination rule described in Sec. 2C3. (a) C1 and C2 are segmented in the forward and backward propagation respectively. For each pair of the 8 sampled points, the optimum boundary point was searched from Pinner,i to Pouter,i. (b) shows the contour segmented in the forward propagation (dark blue), backward propagation (orange) and the optimum contour (light blue) on an axial image. The semiautomatically segmented lumen boundary is also shown (red).
Figure 3
Figure 3
The CPR editing tool. The left panel shows the axial view of a femoral artery 3D MERGE image. The right panel shows the CPR views resampled at 0, π/4, π/2, and 3π/4. The white lines represent the position of the displayed axial/CPR views.
Figure 4
Figure 4
Illustration of the distance- and area-based metrics for comparing two closed boundaries. (a) Distance-based metrics: The symmetric correspondence relationship between two boundaries was first established. Each pair of corresponding points is associated with a distance measurement dj. Mean absolute difference (MAD) and maximum difference (MAXD) are the mean and the maximum distances respectively, calculated over all corresponding pairs. (b) Area-based metrics: Area overlap (AO) is the ratio of the overlapped area (black) to the total area enclosed by two boundaries expressed in percentage. Area difference (AD) is the percentage difference between the areas of two boundaries.
Figure 5
Figure 5
Control points in the CPR views were set at (a) axial slices where manual segmentation was performed in SA0 and (b) the midpoint between two adjacent manually segmented axial slices in SA5. Manual segmentation was performed on every tenth axial slice. White lines represent the location of axial slices where manual segmentation was performed. The purpose of editing at the midpoints was to evaluate segmentation accuracy at slices that were not directly edited.
Figure 6
Figure 6
Segmentation results for three sample slices. The first, second, and third row show examples with good, average and lower than average segmentation accuracy respectively. (a), (c) and (e) show the original images. (b), (d) and (f) are the corresponding images with segmented contours superimposed. Yellow contours represent manual segmentation. Blue and red contours represent semiautomatically segmented wall and lumen boundaries, respectively, using Method SA0.
Figure 7
Figure 7
Bland-Altman plots of tmean comparing (a) M2, (b) SA0, and (c) SA5 with the gold standard M1. Difference values represent tmean of M1 subtracted from that of nongold-standard methods. Lines denoting the mean difference and ±1.96 SDs are also shown.
Figure 8
Figure 8
Bland-Altman plots of tmax comparing (a) M2, (b) SA0, and (c) SA5 with the gold standard M1. Difference values represent tmax of M1 subtracted from that of nongold-standard methods. Lines denoting the mean difference and ±1.96 SDs are also shown.
Figure 9
Figure 9
Bland-Altman plots of WA comparing (a) M2, (b) SA0, and (c) SA5 with the gold standard M1. Difference values represent WA of M1 subtracted from that of nongold-standard methods. Lines denoting the mean difference and ±1.96 SDs are also shown.
Figure 10
Figure 10
These two examples demonstrate the different properties of the maximum thickness (tmax) and the mean thickness (tmean) metrics. (a) and (c) show the original images of two image slices. (b) and (d) show the corresponding images with boundaries superimposed. The green contours in (b) and (d) represent the manual segmentation. The light and dark blue contours represent the outer wall boundaries produced using Methods SA0 and SA5 respectively. The semiautomated segmented lumen boundary is represented by the red contours. In these two examples, Method SA5 overestimated the vessel wall size more than Method SA0, which was reflected by the difference in tmean. However, tmax produced by the two methods were similar.
Figure 11
Figure 11
Wall area measurement comparison between SB1/SB2 and M1. The difference between the correlation coefficients associated with SB1 and SB2 can be explained by the few points with M1 area greater than 35 mm2.
Figure 12
Figure 12
Illustration of the lower image contrast in the middle of a 3D MERGE femoral artery image. Two separate stations were used to obtain the longitudinal coverage, and the SNR was lower in the overlapping region between the two stations (white arrows).

Similar articles

Cited by

References

    1. Belch J. J. F., Topol E. J., Agnelli G., Bertrand M., Califf R. M., Clement D. L., Creager M. A., Easton J. D., Gavin J. R., Greenland P., Hankey G., Hanrath P., Hirsch A. T., Meyer J., Smith S. C., Sullivan F., and Weber M. A., “Critical issues in peripheral arterial disease detection and management: a call to action.,” Arch. Intern. Med. 163, 884–892 (2003).10.1001/archinte.163.8.884 - DOI - PubMed
    1. Ouriel K., “Peripheral arterial disease,” Lancet 358, 1257–1264 (2001).10.1016/S0140-6736(01)06351-6 - DOI - PubMed
    1. Criqui M. H., Langer R. D., Fronek A., Feigelson H. S., Klauber M. R., McCann T. J., and Browner D., “Mortality over a period of 10 years in patients with peripheral arterial disease.,” N. Engl. J. Med. 326, 381–386 (1992).10.1056/NEJM199202063260605 - DOI - PubMed
    1. Glagov S., Weisenberg E., Zarins C. K., Stankunavicius R., and Kolettis G. J., “Compensatory enlargement of human atherosclerotic coronary arteries,” N. Engl. J. Med. 316, 1371–1375 (1987).10.1056/NEJM198705283162204 - DOI - PubMed
    1. Vink A., Schoneveld A. H., Borst C., and Pasterkamp G., “The contribution of plaque and arterial remodeling to de novo atherosclerotic luminal narrowing in the femoral artery.,” J Vasc. Surg. 36, 1194–1198 (2002).10.1067/mva.2002.128300 - DOI - PubMed

Publication types

MeSH terms