. 2011 Dec;44(6):567-81.
doi: 10.1111/j.1365-2184.2011.00789.x. Epub 2011 Oct 13.

In vitro effects of an in silico-modelled 17β-estradiol derivative in combination with dichloroacetic acid on MCF-7 and MCF-12A cells

Affiliations

In vitro effects of an in silico-modelled 17β-estradiol derivative in combination with dichloroacetic acid on MCF-7 and MCF-12A cells

X X Stander et al. Cell Prolif. 2011 Dec.

Abstract

Objectives: To investigate anti-proliferative properties of a novel in silico-modelled 17β-oestradiol derivative (C9), in combination with dichloroacetic acid (DCA), on MCF-7 and MCF-12A cells.

Materials and methods: xCELLigence system was employed to determine optimal seeding number for cells, and crystal violet assay was used to assess cell number and to determine IC(50) value (24 h) for combination treatment. Light and fluorescent microscopy techniques were used to morphologically detect types of cell death. Flow cytometry was used to analyse cell cycle and apoptosis.

Results: Optimal seeding number for 96-well plates was determined to be 5000-10 000 cells/well for both MCF-7 and MCF-12A cells. IC(50) for MCF-7 cells of the combination treatment after 24 h was 130 nm of C9 in conjunction with 7.5 mm of DCA (P < 0.05). In contrast, the same concentration inhibited cell population growth by only 29.3% for MCF-12As after 24-h treatment (P < 0.05). Morphological studies revealed lower cell density of both types of combination-treated cells. Flow cytometric analyses demonstrated increase in sub-G(1) phase in combination-treated MCF-7 cells.

Conclusions: These results demonstrate that the novel 17β-oestradiol derivative C9, in combination with DCA is a potent anti-proliferation treatment, with properties of selectivity towards tumourigenic cells. Thus, this warrants further studies as a potential combination chemotherapeutic agent for further cancer cell lines.


Figures

Figure 1
Figure 1
 Chemical structures of 2‐methoxyestradiol (a) and its 17β‐estradiol derivative (b). (a) 2‐methoxyestradiol (2ME); (b) 2‐ethyl‐3‐O‐sulphamoyl‐estra‐1,3,5(10),15‐tetraen‐3‐ol‐17‐one (C9) (ACD/ChemSketch freeware version 12.0).
Figure 2
Figure 2
 Real‐time dynamic monitoring of cell adhesion and proliferation via the xCELLigence system. MCF‐7 (a) and MCF‐12A (b) seeded at densities of 20 000, 10 000, 5000 and 2500 cells per well in E‐Plates 96 were observed for a period of 48 h.
Figure 3
Figure 3
 Cell number titration expressed as impedance value, namely cell index for both MCF‐7 and MCF‐12A cells with cell densities of 20 000, 10 000, 5000 and 2500 cells/well in the E‐Plate 96 after being monitored for 48 h.*P‐value <0.05 when MCF‐7 and MCF‐12A cells were compared.
Figure 4
Figure 4
 MCF‐7 and MCF‐12A cell population growth expressed as percentage of control (cells propagated in medium and the vehicle, DMSO <0.01%) after 24‐h exposure to different conditions.*, P‐value <0.05 after comparison of cells and controls within the same cell line. P‐value <0.05 when MCF‐7 and MCF‐12A cells were compared for the same treatment.
Figure 5
Figure 5
 PlasDIC images of MCF‐7 cells (left column, images a–e) compared to MCF‐12A cells (right column, images f–j) after 24‐h exposure to different conditions. Vehicle‐treated (a and f) cells were confluent and showed no sign of distress. C9 (130 nm)‐exposed (b and g) cells had decreased cell density and increase in metaphases. Cells exposed to 7.5 mm of DCA (c and h) indicated no significant decrease in cell number. Cells exposed to C9 (130 nm) in combination with DCA (7.5 mm) (d and i) showed significant inhibition in cell population growth. Actinomycin D (0.2 μg/ml)‐treated cells (e and j) exhibited hallmarks of late stages of apoptosis.
Figure 6
Figure 6
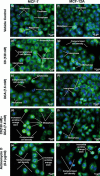
 Fluorescence microscopy utilizing triple fluorescent stains of Hoechst 33342 (stains DNA blue), acridine orange (stains acidic vacuoles green) and propidium iodide (penetrate cell membrane). Fluorescence images of MCF‐7 cells (left column, images a–e) compared to MCF‐12A cells (right column, images f–j) after 24 h of exposure to different conditions. Fluorescence images of MCF‐7 cells (left column, images a–e) compared to MCF‐12A cells (right column, images f–j) after 24‐h exposure to different conditions. Vehicle‐treated (a and f) cells were confluent and showed no sign of distress. C9 (130 nm)‐exposed (b and g) cells showed decreased cell density and increase in metaphases. Cells exposed to 7.5 mm of DCA (c and h) indicated no significant decrease in cell number. Cells exposed to C9 (130 nm) in combination with DCA (7.5 mm) (d and i) showed significant inhibition of cell population growth. Actinomycin D (0.2 μg/ml)‐treated cells (e and j) exhibited hallmarks of late stages of apoptosis.
Figure 7
Figure 7
Cell cycle histograms of vehicle‐, C9− and C9+ DCA‐exposed cells after 24‐h treatment for (a) MCF‐7 and (b) MCF‐12A cells.
Figure 8
Figure 8
 Distribution of DNA content relative to phase of cell cycle of both (a) MCF‐7 and (b) MCF‐12A cells. Data are sub‐ordered to vehicle‐, C9‐, DCA‐, C9 plus DCA‐ and actinomycin D (positive control for apoptosis)‐exposed cells. Both cell lines indicated statistically significant increase in sub‐G1 phase in C9+DCA‐exposed samples compared to vehicle‐treated cells. MCF‐7 cells were more susceptible to combination compounds treatment. *P‐value <0.05 when exposed cells were compared to vehicle controls of the same cell line.
Figure 9
Figure 9
 Apoptosis detection by means of flow cytometry and annexin V‐FITC of MCF‐7 (a) and MCF‐12A (b) cells. Propidium iodide (FL3 Log) versus annexin V‐FITC (FL1 Log) dot‐plots of cells propagated in culture medium, vehicle (DMSO)‐, C9‐, DCA‐, C9+DCA‐ and actinomycin D‐exposed MCF‐7 (a) and MCF‐12A (b) cells. Cells treated with vehicle control (DMSO v/v <0.01%) revealed no toxic effect in both cell lines. Neither C9‐treated nor DCA‐treated MCF‐7 (a) and MCF‐12A (b) cells had severe degree of apoptosis compared to C9+DCA‐exposed cells. *P‐value <0.05 compared to vehicle control of the same cell line. MCF‐7 cells exposed to dual treatment‐induced increased early apoptosis compared to MCF‐12A cells. P‐value <0.05 when MCF‐7 cells were compared to MCF‐12A cells.

References

    1. Zhou J, Giannakakou P (2005) Targeting microtubules for cancer chemotherapy. Curr. Med. Chem. Anticancer Agents 5, 65–71. - PubMed
    1. Islam MN, Iskander MN (2004) Microtubulin binding sites as target for developing anticancer agents. Mini Rev. Med. Chem. 4, 1077–1104. - PubMed
    1. Giannakakou P, Nakano M, Nicolaou KC, O’Brate A, Yu J, Blagosklonny MV et al. (2002) Enhanced microtubule‐dependent trafficking and p53 nuclear accumulation by suppression of microtubule dynamics. Proc. Natl. Acad. Sci. USA 99, 10855–10860. - PMC - PubMed
    1. Jordan MA, Wilson L (2004) Microtubules as a target for anticancer drugs. Nat. Rev. Cancer 4, 253–265. - PubMed
    1. Bunker JM, Wilson L, Jordan MA, Feinstein SC (2004) Modulation of microtubule dynamics by tau in living cells: implications for development and neurodegeneration. Mol. Biol. Cell 15, 2720–2728. - PMC - PubMed

Publication types

MeSH terms