

Availability of a pediatric trauma center in a disaster surge decreases triage time of the pediatric surge population: a population kinetics model
- PMID: 21992575
- PMCID: PMC3224559
- DOI: 10.1186/1742-4682-8-38
Availability of a pediatric trauma center in a disaster surge decreases triage time of the pediatric surge population: a population kinetics model
Abstract
Background: The concept of disaster surge has arisen in recent years to describe the phenomenon of severely increased demands on healthcare systems resulting from catastrophic mass casualty events (MCEs) such as natural disasters and terrorist attacks. The major challenge in dealing with a disaster surge is the efficient triage and utilization of the healthcare resources appropriate to the magnitude and character of the affected population in terms of its demographics and the types of injuries that have been sustained.
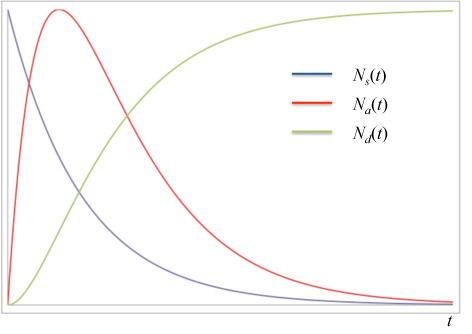
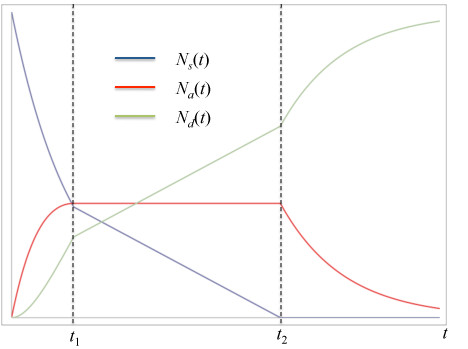
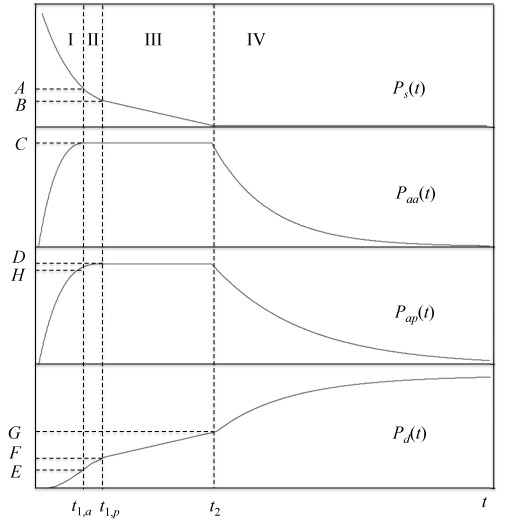
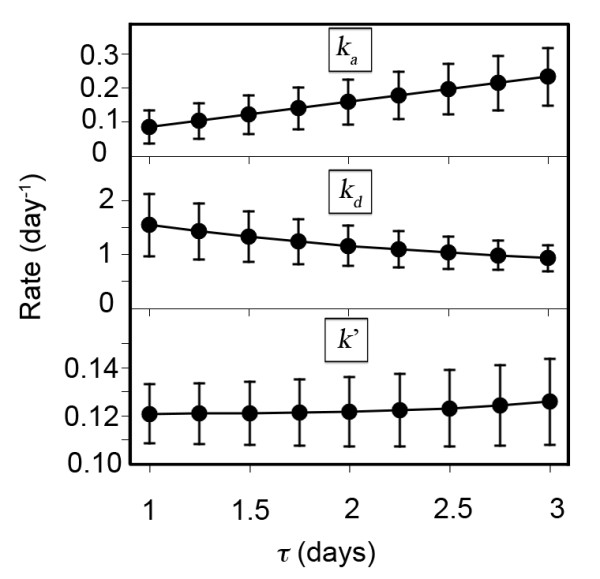
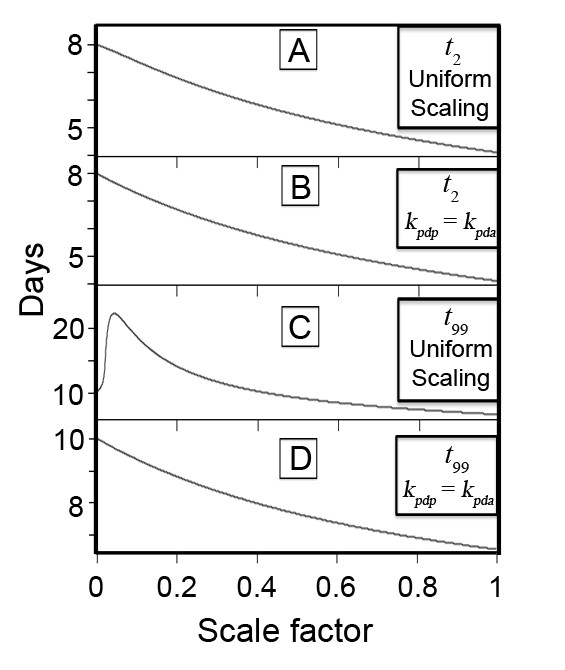
Results: In this paper a deterministic population kinetics model is used to predict the effect of the availability of a pediatric trauma center (PTC) upon the response to an arbitrary disaster surge as a function of the rates of pediatric patients' admission to adult and pediatric centers and the corresponding discharge rates of these centers. We find that adding a hypothetical pediatric trauma center to the response documented in an historical example (the Israeli Defense Forces field hospital that responded to the Haiti earthquake of 2010) would have allowed for a significant increase in the overall rate of admission of the pediatric surge cohort. This would have reduced the time to treatment in this example by approximately half. The time needed to completely treat all children affected by the disaster would have decreased by slightly more than a third, with the caveat that the PTC would have to have been approximately as fast as the adult center in discharging its patients. Lastly, if disaster death rates from other events reported in the literature are included in the model, availability of a PTC would result in a relative mortality risk reduction of 37%.
Conclusions: Our model provides a mathematical justification for aggressive inclusion of PTCs in planning for disasters by public health agencies.
Figures
References
-
- Kreiss Y, Merin O, Peleg K, Levy G, Vinker S. et al. Early disaster response in Haiti: the Israeli field hospital experience. Ann Int Med. 2010;153:45–48. - PubMed
-
- Burkle FM. Population-based triage management in response to surge-capacity requirements during a large-scale bioevent disaster. Acad Emerg Med. 2006;13:118–1129. - PubMed
Publication types
MeSH terms
LinkOut - more resources
Full Text Sources
Medical
Molecular Biology Databases
