. 2011 Oct 12:8:80.
doi: 10.1186/1742-4690-8-80.

Expression and reactivation of HIV in a chemokine induced model of HIV latency in primary resting CD4+ T cells

Affiliations

Expression and reactivation of HIV in a chemokine induced model of HIV latency in primary resting CD4+ T cells

Suha Saleh et al. Retrovirology. .

Abstract

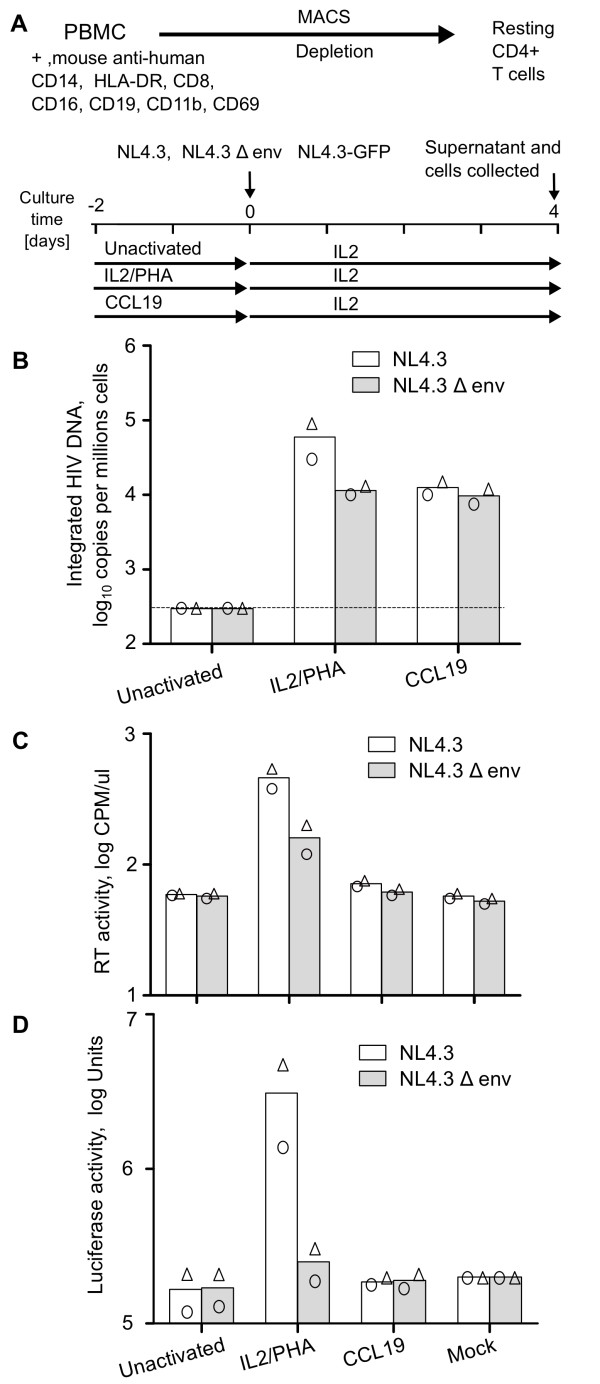
Background: We recently described that HIV latent infection can be established in vitro following incubation of resting CD4+ T-cells with chemokines that bind to CCR7. The main aim of this study was to fully define the post-integration blocks to virus replication in this model of CCL19-induced HIV latency.

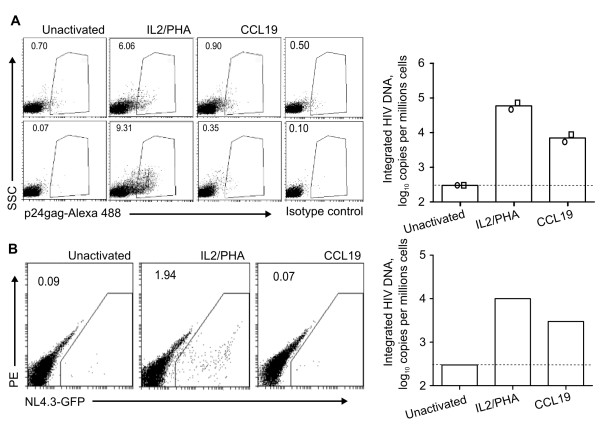
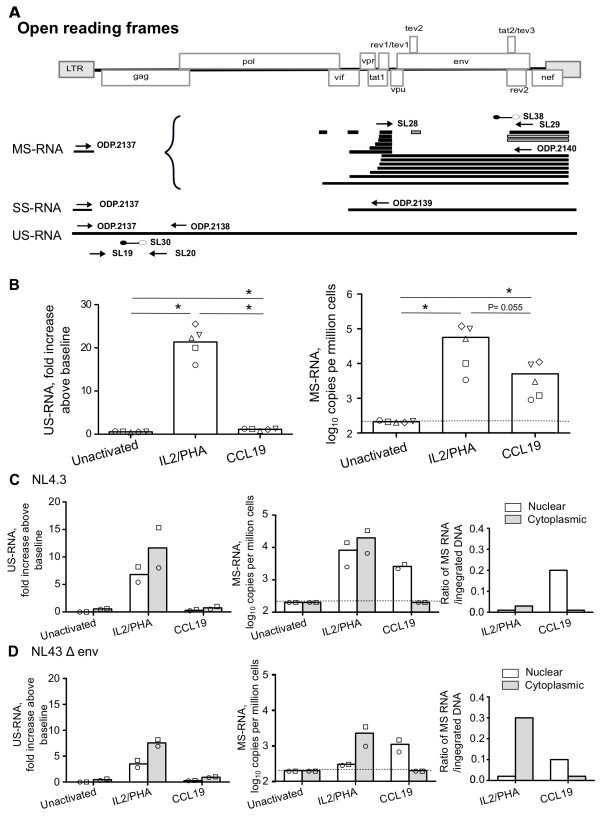
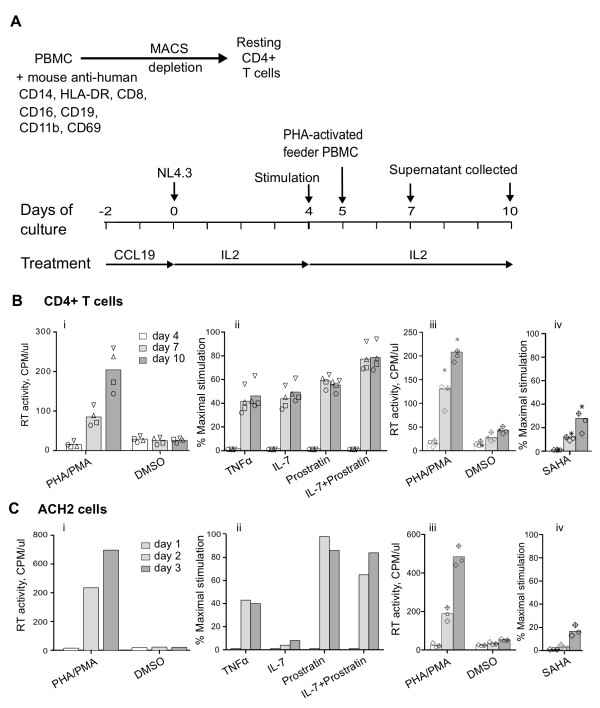
Results: High levels of integrated HIV DNA but low production of reverse transcriptase (RT) was found in CCL19-treated CD4+ T-cells infected with either wild type (WT) NL4.3 or single round envelope deleted NL4.3 pseudotyped virus (NL4.3- Δenv). Supernatants from CCL19-treated cells infected with either WT NL4.3 or NL4.3- Δenv did not induce luciferase expression in TZM-bl cells, and there was no expression of intracellular p24. Following infection of CCL19-treated CD4+ T-cells with NL4.3 with enhanced green fluorescent protein (EGFP) inserted into the nef open reading frame (NL4.3- Δnef-EGFP), there was no EGFP expression detected. These data are consistent with non-productive latent infection of CCL19-treated infected CD4+ T-cells. Treatment of cells with phytohemagluttinin (PHA)/IL-2 or CCL19, prior to infection with WT NL4.3, resulted in a mean fold change in unspliced (US) RNA at day 4 compared to day 0 of 21.2 and 1.1 respectively (p = 0.01; n = 5), and the mean expression of multiply spliced (MS) RNA was 56,000, and 5,000 copies/million cells respectively (p = 0.01; n = 5). In CCL19-treated infected CD4+ T-cells, MS-RNA was detected in the nucleus and not in the cytoplasm; in contrast to PHA/IL-2 activated infected cells where MS RNA was detected in both. Virus could be recovered from CCL19-treated infected CD4+ T-cells following mitogen stimulation (with PHA and phorbyl myristate acetate (PMA)) as well as TNFα, IL-7, prostratin and vorinostat.

Conclusions: In this model of CCL19-induced HIV latency, we demonstrate HIV integration without spontaneous production of infectious virus, detection of MS RNA in the nucleus only, and the induction of virus production with multiple activating stimuli. These data are consistent with ex vivo findings from latently infected CD4+ T-cells from patients on combination antiretroviral therapy, and therefore provide further support of this model as an excellent in vitro model of HIV latency.


Figures

Figure 1
Figure 1
High levels of HIV integration with minimal virus production in CCL19-treated infected CD4+ T-cells consistent with latent infection. (A). Schematic diagram of the experimental protocol used for isolation of CD4+ T-cells and HIV infection. Resting CD4+ T-cells were cultured for 2 days with PHA/IL-2, CCL19 or without activation (unactivated). Cells were then infected with WT NL4.3, NL4.3Δenv or NL4.3-Δnef/EGFP or mock for 2 hrs and virus was washed off. The infected cells were cultured with media containing IL-2 (10 IU/mL) for 4 days. Infection of cells with WT NL4.3 (open bars) or NL4.3Δenv (grey bars) was quantified by detection of (B) integrated HIV DNA (C) RT activity (CPM/μl) in culture supernatant or (D) luciferase activity of supernatants using the TZM-bl indicator cell line. In all graphs, the mean (column) and individual data (open symbols) from two donors are shown.
Figure 2
Figure 2
No productive HIV infection in CCL19-treated infected cells. Resting CD4+ T cells were cultured for 2 days with PHA/IL-2, CCL19 or without activation (unactivated). Cells were infected with NL4.3 or NL4.3-Δnef/EGFP for 2 hrs. The virus was washed off and the infected cells were cultured with media containing IL-2 (10 IU/mL) for up to 4 days. Productive infection was detected by flow cytometry of (A) intracellular HIV p24 (Alexa-488) following infection with NL4.3 (left panels; two representative donors). The right hand panels show the corresponding integrated copies of HIV per million cells for the same donors (as the mean of two donors (column) and as individual data (open symbols)). (B) Productive infection was detected by flow cytometry of EGFP expression following infection with NL4.3-Δnef/EGFP (one donor). The integrated copies of HIV per million cells are shown for this donor (right hand panel). SSC = side scatter.
Figure 3
Figure 3
High level of nuclear MS RNA in CCL19-treated latently infected CD4+ T-cells. (A) Schematic diagram of the broad classes of HIV mRNA, including multiply spliced (MS) singly spliced (SS) and unspliced (US) HIV RNA (adapted from [56]). Location of primers and probes used for real-time PCR quantification of US, SS and MS RNA are shown. (B) Resting CD4+ T cells were activated with IL-2/PHA, CCL19 or unactivated and infected with NL4.3 or NL4.3Δenv. The fold increase in US RNA at day 4 post infection (relative to day 0; left panels) and the absolute copies per million cells of MS RNA (right panels) is shown for (B) total RNA following infection with WT NL4.3 (n = 5) and (C and D) nuclear (open) and cytoplasmic (grey) fractions following infection with (C) NL4.3 and (D) NL4.3Δenv. The mean (column) and individual data (open symbols) are shown. The ratio of MS RNA to integrated DNA for each donor is also shown (C and D, far right panel). The detection limit for US RNA and MS RNA was 200 copies/106 cells and is shown as dashed line for MS RNA. * = P < 0.05.
Figure 4
Figure 4
Virus production from latently infected CCL19 stimulated cells. (A) Schematic diagram of the experimental protocol used for infection and restimulation of CCL19-treated resting CD4+ T-cells. Resting CD4+ T-cells were cultured for 2 days with CCL19 and infected with NL4.8 and then restimulated with different activation agents at day 4 post- infection (PI). PHA-stimulated activated PBMCs were added at a ratio of 2:1. The cultures were maintained in IL-2 alone. Supernatant was harvested at day 7 and 10 PI to detect RT activity. (B) RT activity (CPM/μl) was measured following incubation of CCL19-treated infected CD4+ T-cells with (i) PHA/PMA (maximal stimulation) or with DMSO, (ii) TNFα, IL-7, prostratin and the combination of IL-7 with prostratin (expressed as percentage of maximal stimulation), (iii) PHA/PMA or DMSO (from different donors for vorinostat (SAHA) experiments) or (iv) vorionostat (SAHA) expressed as percentage of maximal stimulation (from (iii)). The mean (column) and individual data (open symbols) from four donors are shown. (C) The latently infected cell line ACH2 was also incubated with the same stimuli as in (B) and supernatant collected at day 1, 2 and 3 post stimulation. The mean (column) and individual data (open symbols) from three separate experiments, following activation with vorinostat (SAHA) are shown.

References

    1. Chun TW, Carruth L, Finzi D, Shen X, DiGiuseppe JA, Taylor H, Hermankova M, Chadwick K, Margolick J, Quinn TC. et al.Quantification of latent tissue reservoirs and total body viral load in HIV-1 infection. Nature. 1997;387:183–188. doi: 10.1038/387183a0. - DOI - PubMed
    1. Chun TW, Finzi D, Margolick J, Chadwick K, Schwartz D, Siliciano RF. In vivo fate of HIV-1-infected T cells: quantitative analysis of the transition to stable latency. Nat Med. 1995;1:1284–1290. doi: 10.1038/nm1295-1284. - DOI - PubMed
    1. Finzi D, Hermankova M, Pierson T, Carruth LM, Buck C, Chaisson RE, Quinn TC, Chadwick K, Margolick J, Brookmeyer R. et al.Identification of a reservoir for HIV-1 in patients on highly active antiretroviral therapy. Science. 1997;278:1295–1300. doi: 10.1126/science.278.5341.1295. - DOI - PubMed
    1. Lewin SR, Rouzioux C. HIV cure and eradication: how will we get from the laboratory to effective clinical trials? Aids. 2011;25:885–897. doi: 10.1097/QAD.0b013e3283467041. - DOI - PubMed
    1. Chomont N, El-Far M, Ancuta P, Trautmann L, Procopio FA, Yassine-Diab B, Boucher G, Boulassel MR, Ghattas G, Brenchley JM. et al.HIV reservoir size and persistence are driven by T cell survival and homeostatic proliferation. Nat Med. 2009;15:893–900. doi: 10.1038/nm.1972. - DOI - PMC - PubMed

Publication types

MeSH terms

Substances