. 2011 Dec;10(12):2350-62.
doi: 10.1158/1535-7163.MCT-11-0497. Epub 2011 Oct 12.

Dual inhibition of tumor energy pathway by 2-deoxyglucose and metformin is effective against a broad spectrum of preclinical cancer models

Affiliations

Dual inhibition of tumor energy pathway by 2-deoxyglucose and metformin is effective against a broad spectrum of preclinical cancer models

Jae-Ho Cheong et al. Mol Cancer Ther. 2011 Dec.

Abstract

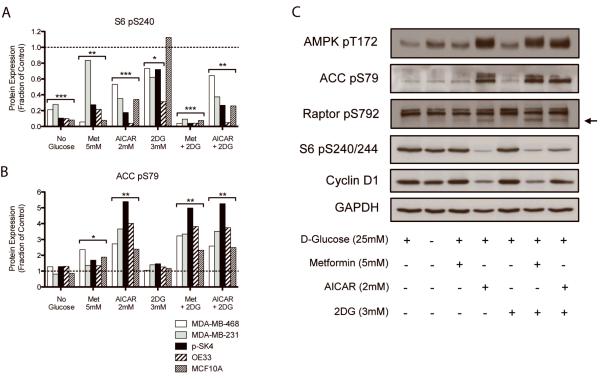
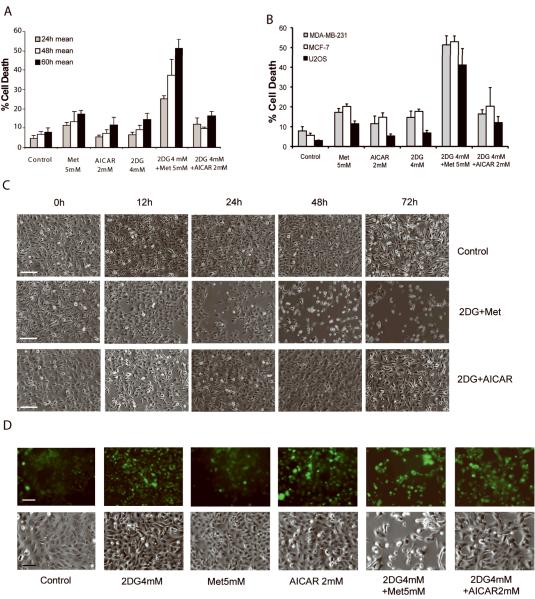
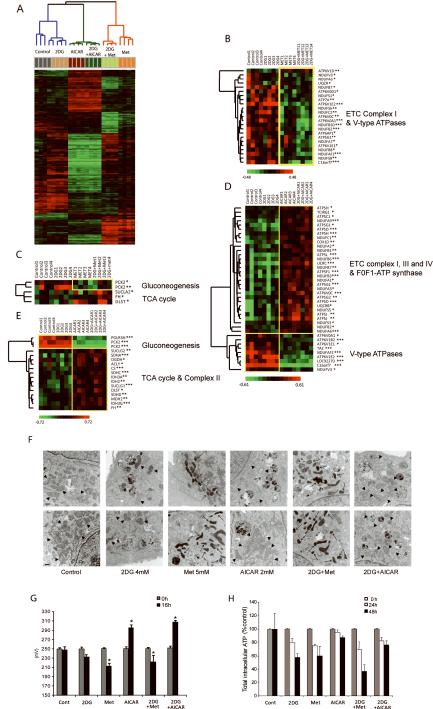
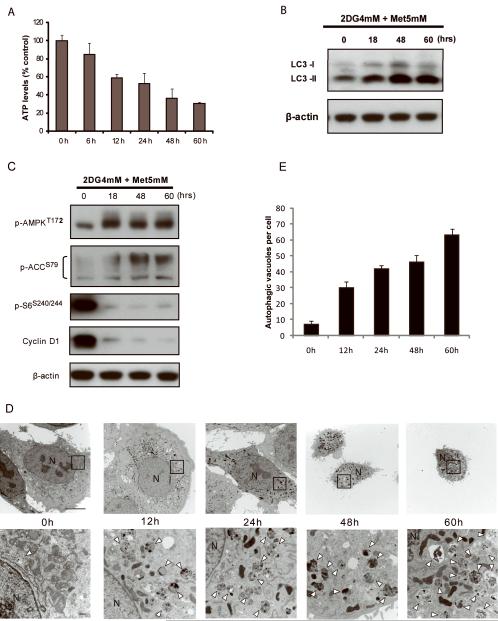
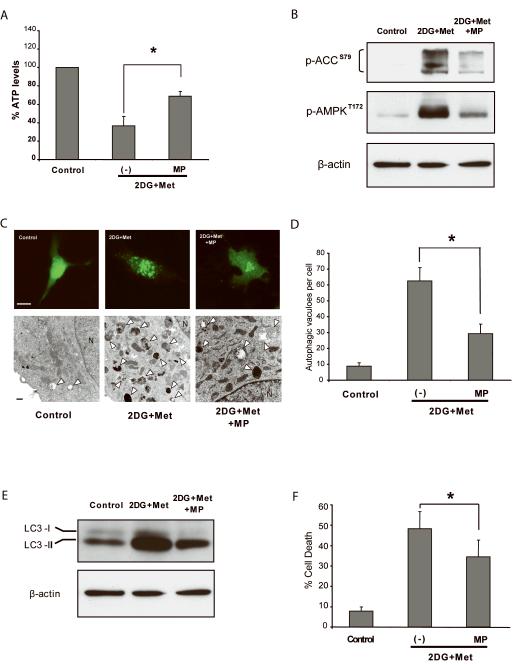
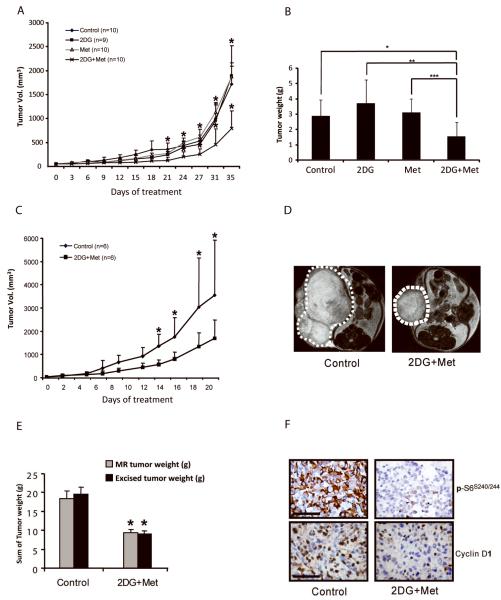
Tumor cell proliferation requires both growth signals and sufficient cellular bioenergetics. The AMP-activated protein kinase (AMPK) pathway seems dominant over the oncogenic signaling pathway suppressing cell proliferation. This study investigated the preclinical efficacy of targeting the tumor bioenergetic pathway using a glycolysis inhibitor 2-deoxyglucose (2DG) and AMPK agonists, AICAR and metformin. We evaluated the in vitro antitumor activity of 2DG, metformin or AICAR alone, and 2DG in combination either with metformin or AICAR. We examined in vivo efficacy using xenograft mouse models. 2DG alone was not sufficient to promote tumor cell death, reflecting the limited efficacy showed in clinical trials. A combined use of 2DG and AICAR also failed to induce cell death. However, 2DG and metformin led to significant cell death associated with decrease in cellular ATP, prolonged activation of AMPK, and sustained autophagy. Gene expression analysis and functional assays revealed that the selective AMPK agonist AICAR augments mitochondrial energy transduction (OXPHOS) whereas metformin compromises OXPHOS. Importantly, forced energy restoration with methyl pyruvate reversed the cell death induced by 2DG and metformin, suggesting a critical role of energetic deprivation in the underlying mechanism of cell death. The combination of 2DG and metformin inhibited tumor growth in mouse xenograft models. Deprivation of tumor bioenergetics by dual inhibition of energy pathways might be an effective novel therapeutic approach for a broad spectrum of human tumors.


Figures

Figure 1
Figure 1. AICAR and the combination of 2DG and metformin activate AMPK and reduce phosphorylation of mTORC1-regulated proteins
A and B, Protein levels of lysates from multiple cell lines were quantified by RPPA after treatment with the indicated compounds for 24 h. Phosphorylations of S6 and ACC were quantified to evaluate signaling changes downstream of mTORC1 and AMPK, respectively. Values were compared to the untreated controls (broken lines) using a two-tailed t-test. * p<0.05, **p<0.01, ***p<0.001 C, Western blot analysis of p-SK4 cells lysate.
Figure 2
Figure 2. 2DG combined with metformin selectively promotes death of cancer cells
Cell viability was assessed by trypan blue exclusion.Data are the mean ± S.D. (n=3) of at least 100 cells from one representative experiment of at least four independent experiments. A, p-SK4 cells were treated with indicated agents and viability was assessed. B, Viability of breast (MDA-231 and MCF-7) and osteosarcoma (U2OS) cell lines was assessed at 72 hours. C, p-SK4 cells were treated with 2DG+Met or 2DG +AICAR for the indicated times and representative photomicrographs taken. Scale bar, 100μm. D, GFP-LC3 transfected U2OS cells were incubated for 72h with the indicated compounds (Upper panel, fluorescence analysis; lower panel, bright fields; Scale bars, 100μm).
Figure 3
Figure 3. AICAR and metformin effects on gene expression are distinct and opposing for genes related to the mitochondrial energy transduction
p-SK4 cells were treated with 2DG (4mM), metformin (5mM), AICAR (2mM), 2DG+Met, or 2DG+AICAR for 12 hours. A, Class comparisons were performed between the six treatment groups using genes filtered with one-way ANOVA. Clustering analysis of genes showed significant differences between AICAR and metformin treatment (2527 significant genes, p-value < 10−6). B,C,D and E, Supervised clustering analyses were performed for genes related to the mitochondrial energy transduction, gluconeogensis, and the TCA cycle.* p<0.05, **p<0.01, ***p<0.001. F, TEM of p-SK4 cells after incubation with indicated treatments for 12 hr (Upper panel) and 24 hr (Lower panel). Normal (arrowhead) and abnormally shrunken electron dense mitochondria (arrow) are indicated. Scale bar, 500nm. G, Mitochondrial transmembrane potential (ΔΨm) of p-SK4 cells incubated with indicated compounds (*p<0.05 compared to control, 2DG, AICAR, or 2DG+AICAR). H, Intracellular ATP levels were measured at each time point after treatment of indicated agents with a luciferase-based assay. Values were normalized based on cell numbers. Data are mean ± S.D. (n=3) of one representative of at least three independent experiments.
Figure 4
Figure 4. Prolonged incubation with 2DG and metformin depletes cellular ATP, activates AMPK, suppresses mTORC1 downstream signaling, and sustains autophagy
p-SK4 cells were incubated with 2DG and metformin for the indicated times. A, Cellular ATP levels determined. Data are the mean ± S.D. (n=3) B, Western blotting for LC3 expression. β-actin was used as loading control. C, Kinetics of signaling molecules in AMPK and mTORC1 downstream. Western blots of samples from 4B. D, TEM analysis of morphologic alteration of cells treated with 2DG in combination with metformin. Severe cytoplasmic contraction and resultant membrane blebbing is evident (48 and 60h). Note most of the cytoplasm is replaced with autophagosomes (60h). Neither typical apoptotic nor necrotic cells are evident (N, nucleus; arrowheads, autophagosome; Scale bar, 10μm for upper panel; 500nm for lower panel). E, Autophagic vesicles were counted for three randomly selected cells from each electron microscopy section. Data presented mean ± S.D.
Figure 5
Figure 5. Exogenous energy substrate methyl pyruvate (MP) increases cellular ATP, decreases AMPK activation, and reduces autophagy and cell death
p-SK4 cells were treated with 2DG (4mM) and metformin (5mM) with and without methylpyruvate (MP, 10mM). A, Intracellular ATP levels were measured at 72 hours *p<0.01. B, Western blotting (lysates from 5A) to assess AMPK activation. β-actin was used as loading control. C, Autophagy analsysis by fluorescence microscopy of GFP-LC3 punctate patterns (upper panel) and TEM (lower panel). (N, nucleus; arrowheads, autophagosome; Scale bar, 10μm for upper panel; 500nm for lower panel). D, Quantitation of autophagosomes on TEM. Autophagic vesicles were counted for three randomly selected cells from each electron microscopy section. Data presented mean ± S.D. *p<0.01. E, Cell lysates (samples from5A) were subject to western blotting to assess LC3 expression and lipidation (LC3-II), an autophagy marker. F, Cell death assay by trypan blue exclusion. *p<0.05. All assays were performed at 72 hours except 6C, which was 60 hours. Data are mean ± S.D. (n=3).
Figure 6
Figure 6. Effects of 2DG and metformin on xenograft tumor growth
A, Tumors were established in athymic nude female mice by mammary fat pad injection of 6.5×10⁶ MDA-MB-231 cells and treated as described in Methods. The mean tumor volume ± S.D. is presented. * p<0.05 compared to control, 2DG alone or metformin alone. B, Ex vivo tumor weight of tumors from 6 A. * p<0.05, ** p<0.01 and *** p=0.01. C, Tumors were established in athymic nude female mice by subcutaneous injection of 4×10⁶ s-SK4 cells and treated as described in Methods. Mean tumor volume ± S.D is presented. * p<0.05. D, Representative MR images. E, Tumor weight by 2DG+metformin as assessed by in vivo MRI and excised tumors. * p < 0.05. F, Immunohistochemical analysis of p-S6 and cyclin D1 levels in paraffin embedded xenograft tumor tissues. Scale bar, 100μm.

References

    1. Warburg O. On the origin of cancer cells. Science. 1956;123:309–14. - PubMed
    1. Downey RJ, Akhurst T, Gonen M, Vincent A, Bains MS, Larson S, et al. Preoperative F-18 fluorodeoxyglucose-positron emission tomography maximal standardized uptake value predicts survival after lung cancer resection. J Clin Oncol. 2004;22:3255–60. - PubMed
    1. Gatenby RA, Gillies RJ. Why do cancers have high aerobic glycolysis? Nat Rev Cancer. 2004;4:891–9. - PubMed
    1. Kumar R, Mavi A, Bural G, Alavi A. Fluorodeoxyglucose-PET in the management of malignant melanoma. Radiol Clin North Am. 2005;43:23–33. - PubMed
    1. DeBerardinis RJ, Lum JJ, Hatzivassiliou G, Thompson CB. The biology of cancer: metabolic reprogramming fuels cell growth and proliferation. Cell Metab. 2008;7:11–20. - PubMed

Publication types

MeSH terms