Comparative Study
. 2011 Oct 12;478(7370):476-82.
doi: 10.1038/nature10530.

A high-resolution map of human evolutionary constraint using 29 mammals

Kerstin Lindblad-Toh  1 Manuel GarberOr ZukMichael F LinBrian J ParkerStefan WashietlPouya KheradpourJason ErnstGregory JordanEvan MauceliLucas D WardCraig B LoweAlisha K HollowayMichele ClampSante GnerreJessica AlföldiKathryn BealJean ChangHiram ClawsonJames CuffFederica Di PalmaStephen FitzgeraldPaul FlicekMitchell GuttmanMelissa J HubiszDavid B JaffeIrwin JungreisW James KentDennis KostkaMarcia LaraAndre L MartinsTim MassinghamIda MoltkeBrian J RaneyMatthew D RasmussenJim RobinsonAlexander StarkAlbert J VilellaJiayu WenXiaohui XieMichael C ZodyBroad Institute Sequencing Platform and Whole Genome Assembly TeamJen BaldwinToby BloomChee Whye ChinDave HeimanRobert NicolChad NusbaumSarah YoungJane WilkinsonKim C WorleyChristie L KovarDonna M MuznyRichard A GibbsBaylor College of Medicine Human Genome Sequencing Center Sequencing TeamAndrew CreeHuyen H DihnGerald FowlerShalili JhangianiVandita JoshiSandra LeeLora R LewisLynne V NazarethGeoffrey OkwuonuJireh SantibanezWesley C WarrenElaine R MardisGeorge M WeinstockRichard K WilsonGenome Institute at Washington UniversityKim DelehauntyDavid DoolingCatrina FronikLucinda FultonBob FultonTina GravesPatrick MinxErica SodergrenEwan BirneyElliott H MarguliesJavier HerreroEric D GreenDavid HausslerAdam SiepelNick GoldmanKatherine S PollardJakob S PedersenEric S LanderManolis Kellis
Affiliations
Comparative Study

A high-resolution map of human evolutionary constraint using 29 mammals

Kerstin Lindblad-Toh et al. Nature. .

Abstract

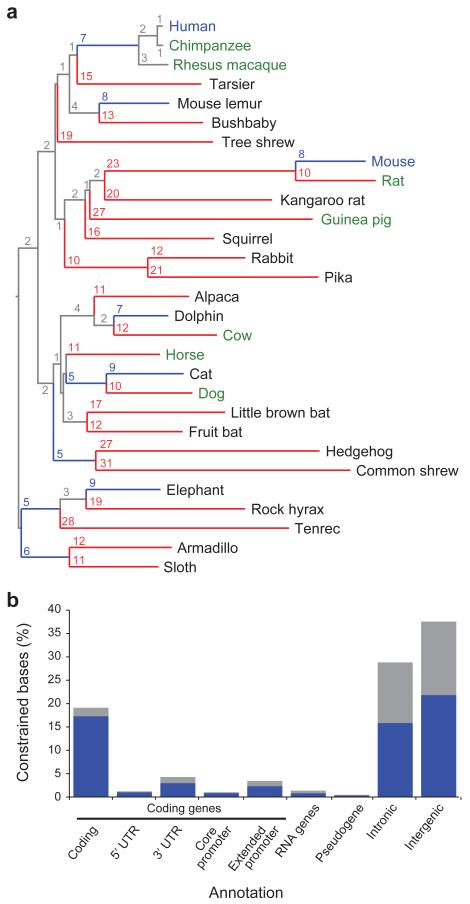
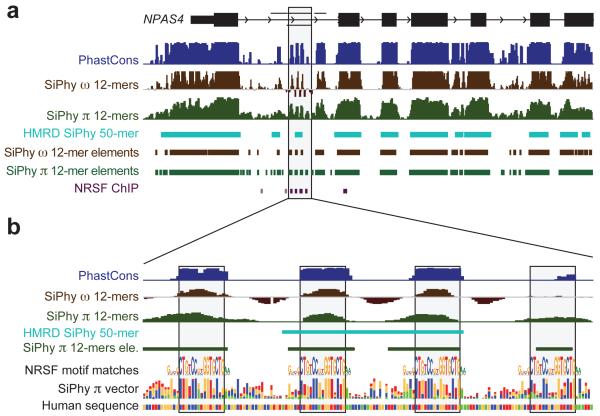
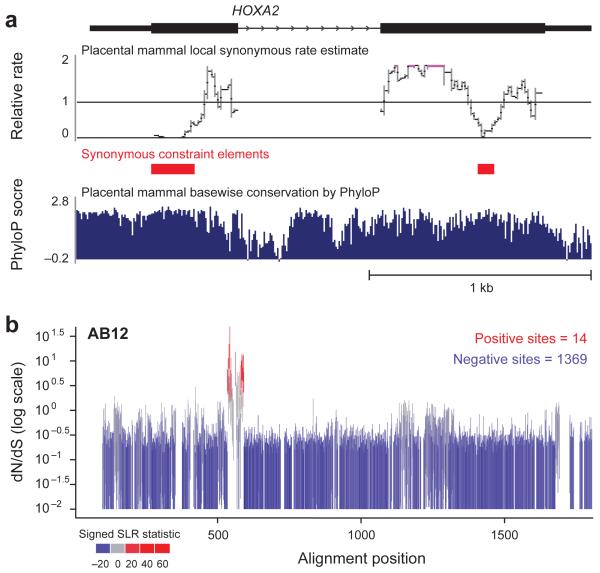
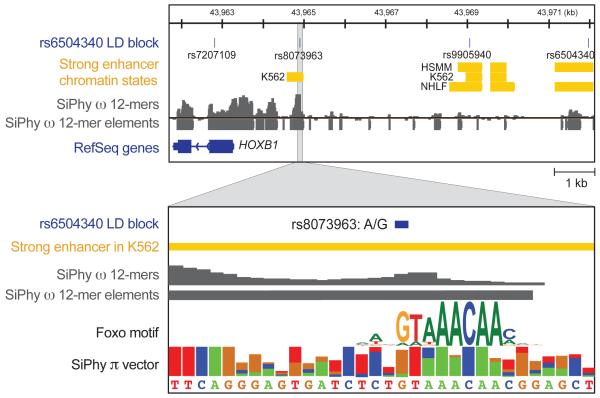
The comparison of related genomes has emerged as a powerful lens for genome interpretation. Here we report the sequencing and comparative analysis of 29 eutherian genomes. We confirm that at least 5.5% of the human genome has undergone purifying selection, and locate constrained elements covering ∼4.2% of the genome. We use evolutionary signatures and comparisons with experimental data sets to suggest candidate functions for ∼60% of constrained bases. These elements reveal a small number of new coding exons, candidate stop codon readthrough events and over 10,000 regions of overlapping synonymous constraint within protein-coding exons. We find 220 candidate RNA structural families, and nearly a million elements overlapping potential promoter, enhancer and insulator regions. We report specific amino acid residues that have undergone positive selection, 280,000 non-coding elements exapted from mobile elements and more than 1,000 primate- and human-accelerated elements. Overlap with disease-associated variants indicates that our findings will be relevant for studies of human biology, health and disease.


Figures

Figure 1
Figure 1. Phylogeny and constrained elements from the 29 eutherian mammalian genome sequences
a, A phylogenetic tree of all 29 mammals used in this analysis based on the substitution rates in the MultiZ alignments. Organisms with finished genome sequences are indicated in blue, high quality drafts in green and 2X assemblies in black. Substitutions per 100 bp are given for each branch, and branches with ≥ 10 substitutions are colored red, while blue indicates < 10 substitutions. b, At 10% FDR, 3.6 million constrained elements can be detected encompassing 4.2% of the genome, including a substantial fraction of newly detected bases (blue) compared to the union of the HMRD 50-bp + Siepel vertebrate elements (see Figure S4b for comparison to HMRD elements only). The largest fraction of constraint can be seen in coding exons, introns and intergenic regions. For unique counts, the analysis was performed hierarchically: coding exons, 5′-UTRs, 3′-UTRs, promoters, pseudogenes, non-coding RNAs, introns, intergenic. The constrained bases are particularly enriched in coding transcripts and their promoters (Supp Fig S4c).
Figure 2
Figure 2. Identification of four NRSF-binding sites in NPAS4
a. The neurological gene NPAS4 has many constrained elements overlapping introns and the upstream intergenic region. The gray shaded box contained only one constrained element using HMRD, while analysis of 29 mammalian sequences reveals four smaller elements. b, These four constrained elements in the first intron correspond to binding sites for the NRSF transcription factor, known to regulate neuronal lineages.
Figure 3
Figure 3. Examination of evolutionary signatures identifies synonymous constrained elements (SCEs) and evidence of positive selection
a, Two regions within the HOXA2 open reading frame are identified as Synonymous Constraint Elements (red), corresponding to overlapping functional elements within coding regions. Note that the synonymous rate reductions are not obvious from the base-wise conservation measure (in blue). Both elements have been characterized as enhancers driving Hoxa2 expression in distinct segments of the developing mouse hindbrain. The element in the first exon encodes Hox-Pbx binding sites and drives expression in rhombomere 4, while the element in the second exon contains Sox binding sites and drives expression in rhombomere 2. Synonymous constraint elements are also found in most other Hox genes, and up to a quarter of all genes. b, While ~85% of genes show only negative (purifying) selection and 9 % of genes show uniform positive selection, the remaining 6% of genes, including ABI2, show only localized regions of positively-selected sites. Each vertical bar covers the estimated 95% confidence interval for dN/dS at that site (with values of 0 truncated to 0.01 to accommodate the log scaling), and bars are colored according to a signed version of the SLR statistic for non-neutral evolution: blue for sites under purifying selection, gray for neutral sites, and red for sites under positive selection.
Figure 4
Figure 4. Utilizing constraint to identify candidate mutations
Conservation can help us resolve amidst multiple SNPs the ones that disrupt conserved functional elements and are likely to have regulatory roles. In this example, a SNP (rs6504340) associated with tooth development is perfectly linked to a conserved intergenic SNP, rs8073963, 7.1kb away, which disrupts a deeply conserved Forkhead-family motif in a strong enhancer. While the SNPs shown here stem from GWAs or HAPMAP data, the same principle should be applicable also to associated variants detected by resequencing the region of interest.

Comment in

References

    1. Lander ES, et al. Initial sequencing and analysis of the human genome. Nature. 2001;409:860–921. doi:10.1038/35057062. - PubMed
    1. Waterston RH, et al. Initial sequencing and comparative analysis of the mouse genome. Nature. 2002;420:520–562. doi:10.1038/nature01262 nature01262 [pii] - PubMed
    1. Gibbs RA, et al. Genome sequence of the Brown Norway rat yields insights into mammalian evolution. Nature. 2004;428:493–521. doi:10.1038/nature02426 nature02426 [pii] - PubMed
    1. Lindblad-Toh K, et al. Genome sequence, comparative analysis and haplotype structure of the domestic dog. Nature. 2005;438:803–819. doi:nature04338 [pii] 10.1038/nature04338. - PubMed
    1. Altshuler D, Daly MJ, Lander ES. Genetic mapping in human disease. Science. 2008;322:881–888. doi:322/5903/881 [pii] 10.1126/science.1156409. - PMC - PubMed

Publication types