. 2011 Nov;3(11):1063-70.
doi: 10.1039/c1ib00061f. Epub 2011 Oct 12.

Vascular smooth muscle contractility depends on cell shape

Affiliations

Vascular smooth muscle contractility depends on cell shape

Patrick W Alford et al. Integr Biol (Camb). 2011 Nov.

Abstract

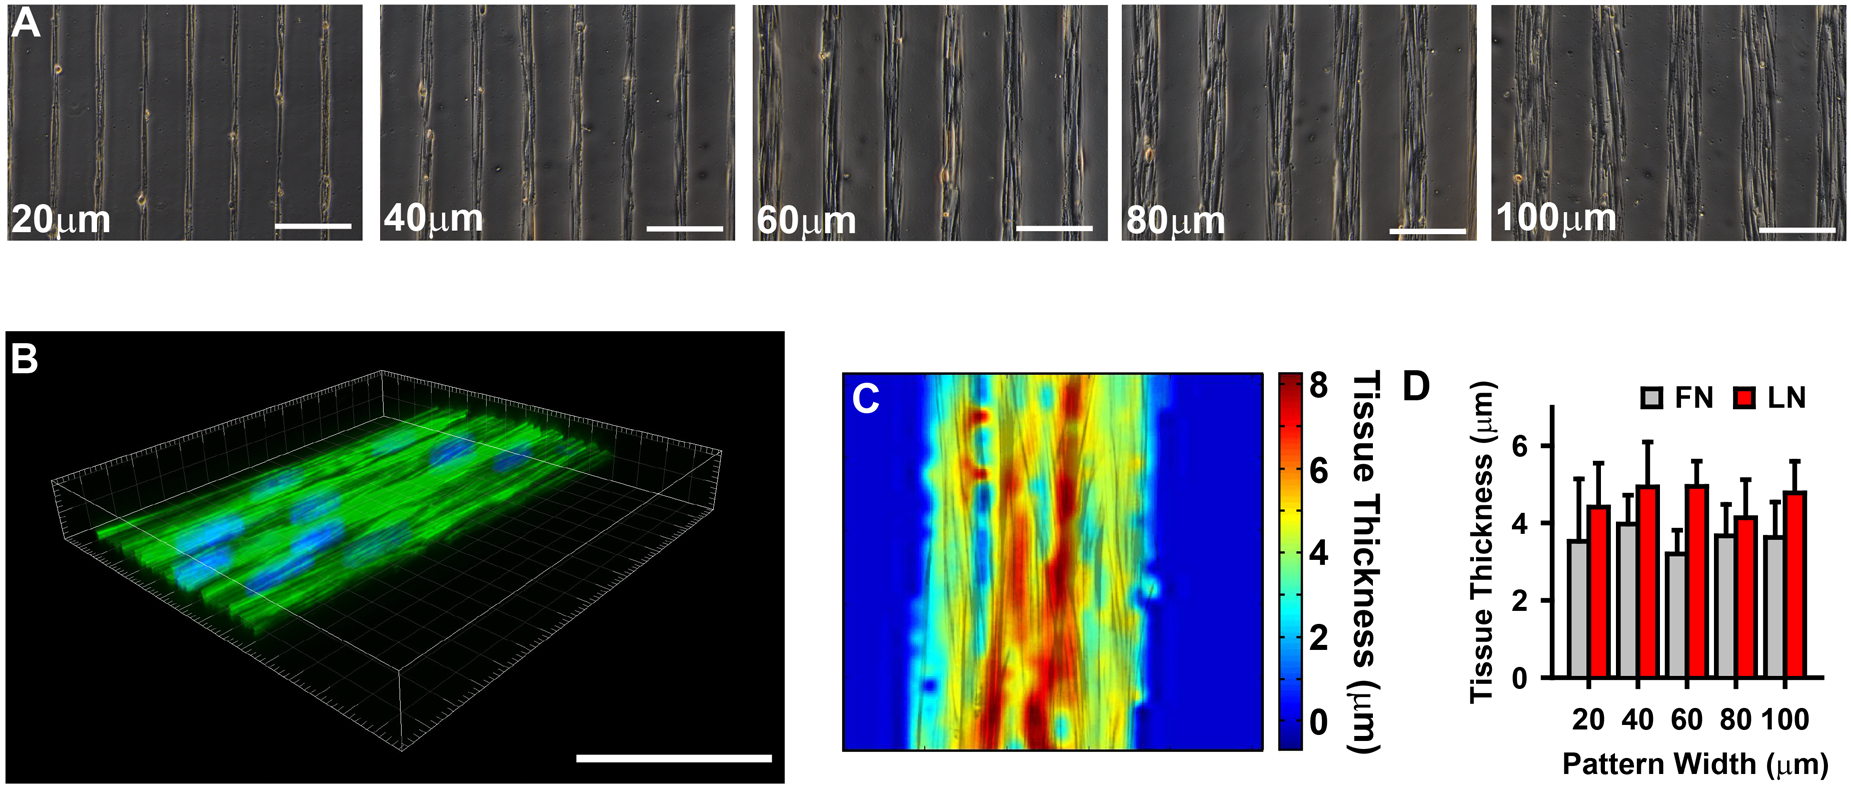
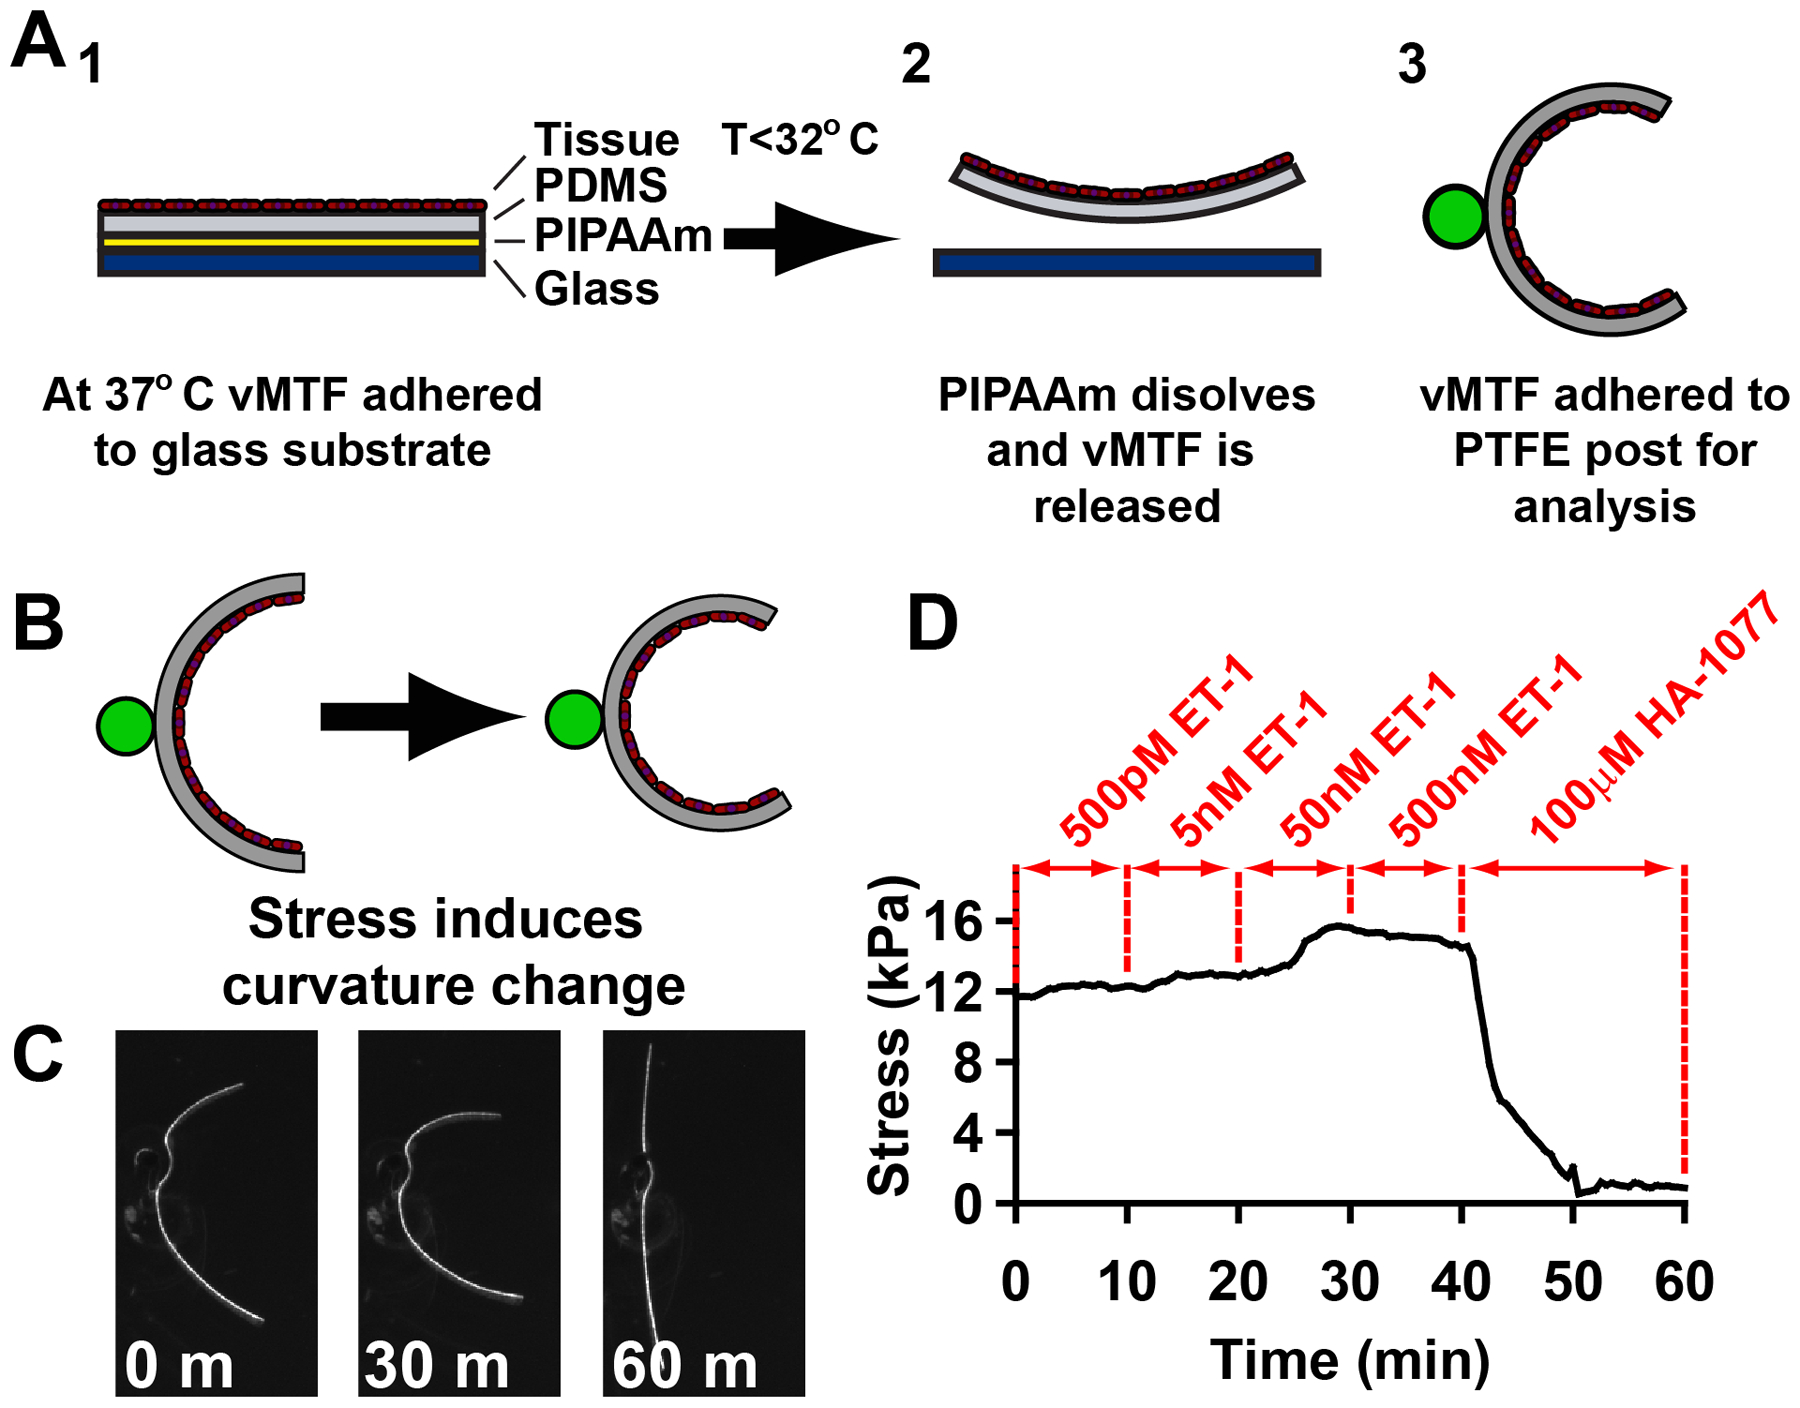
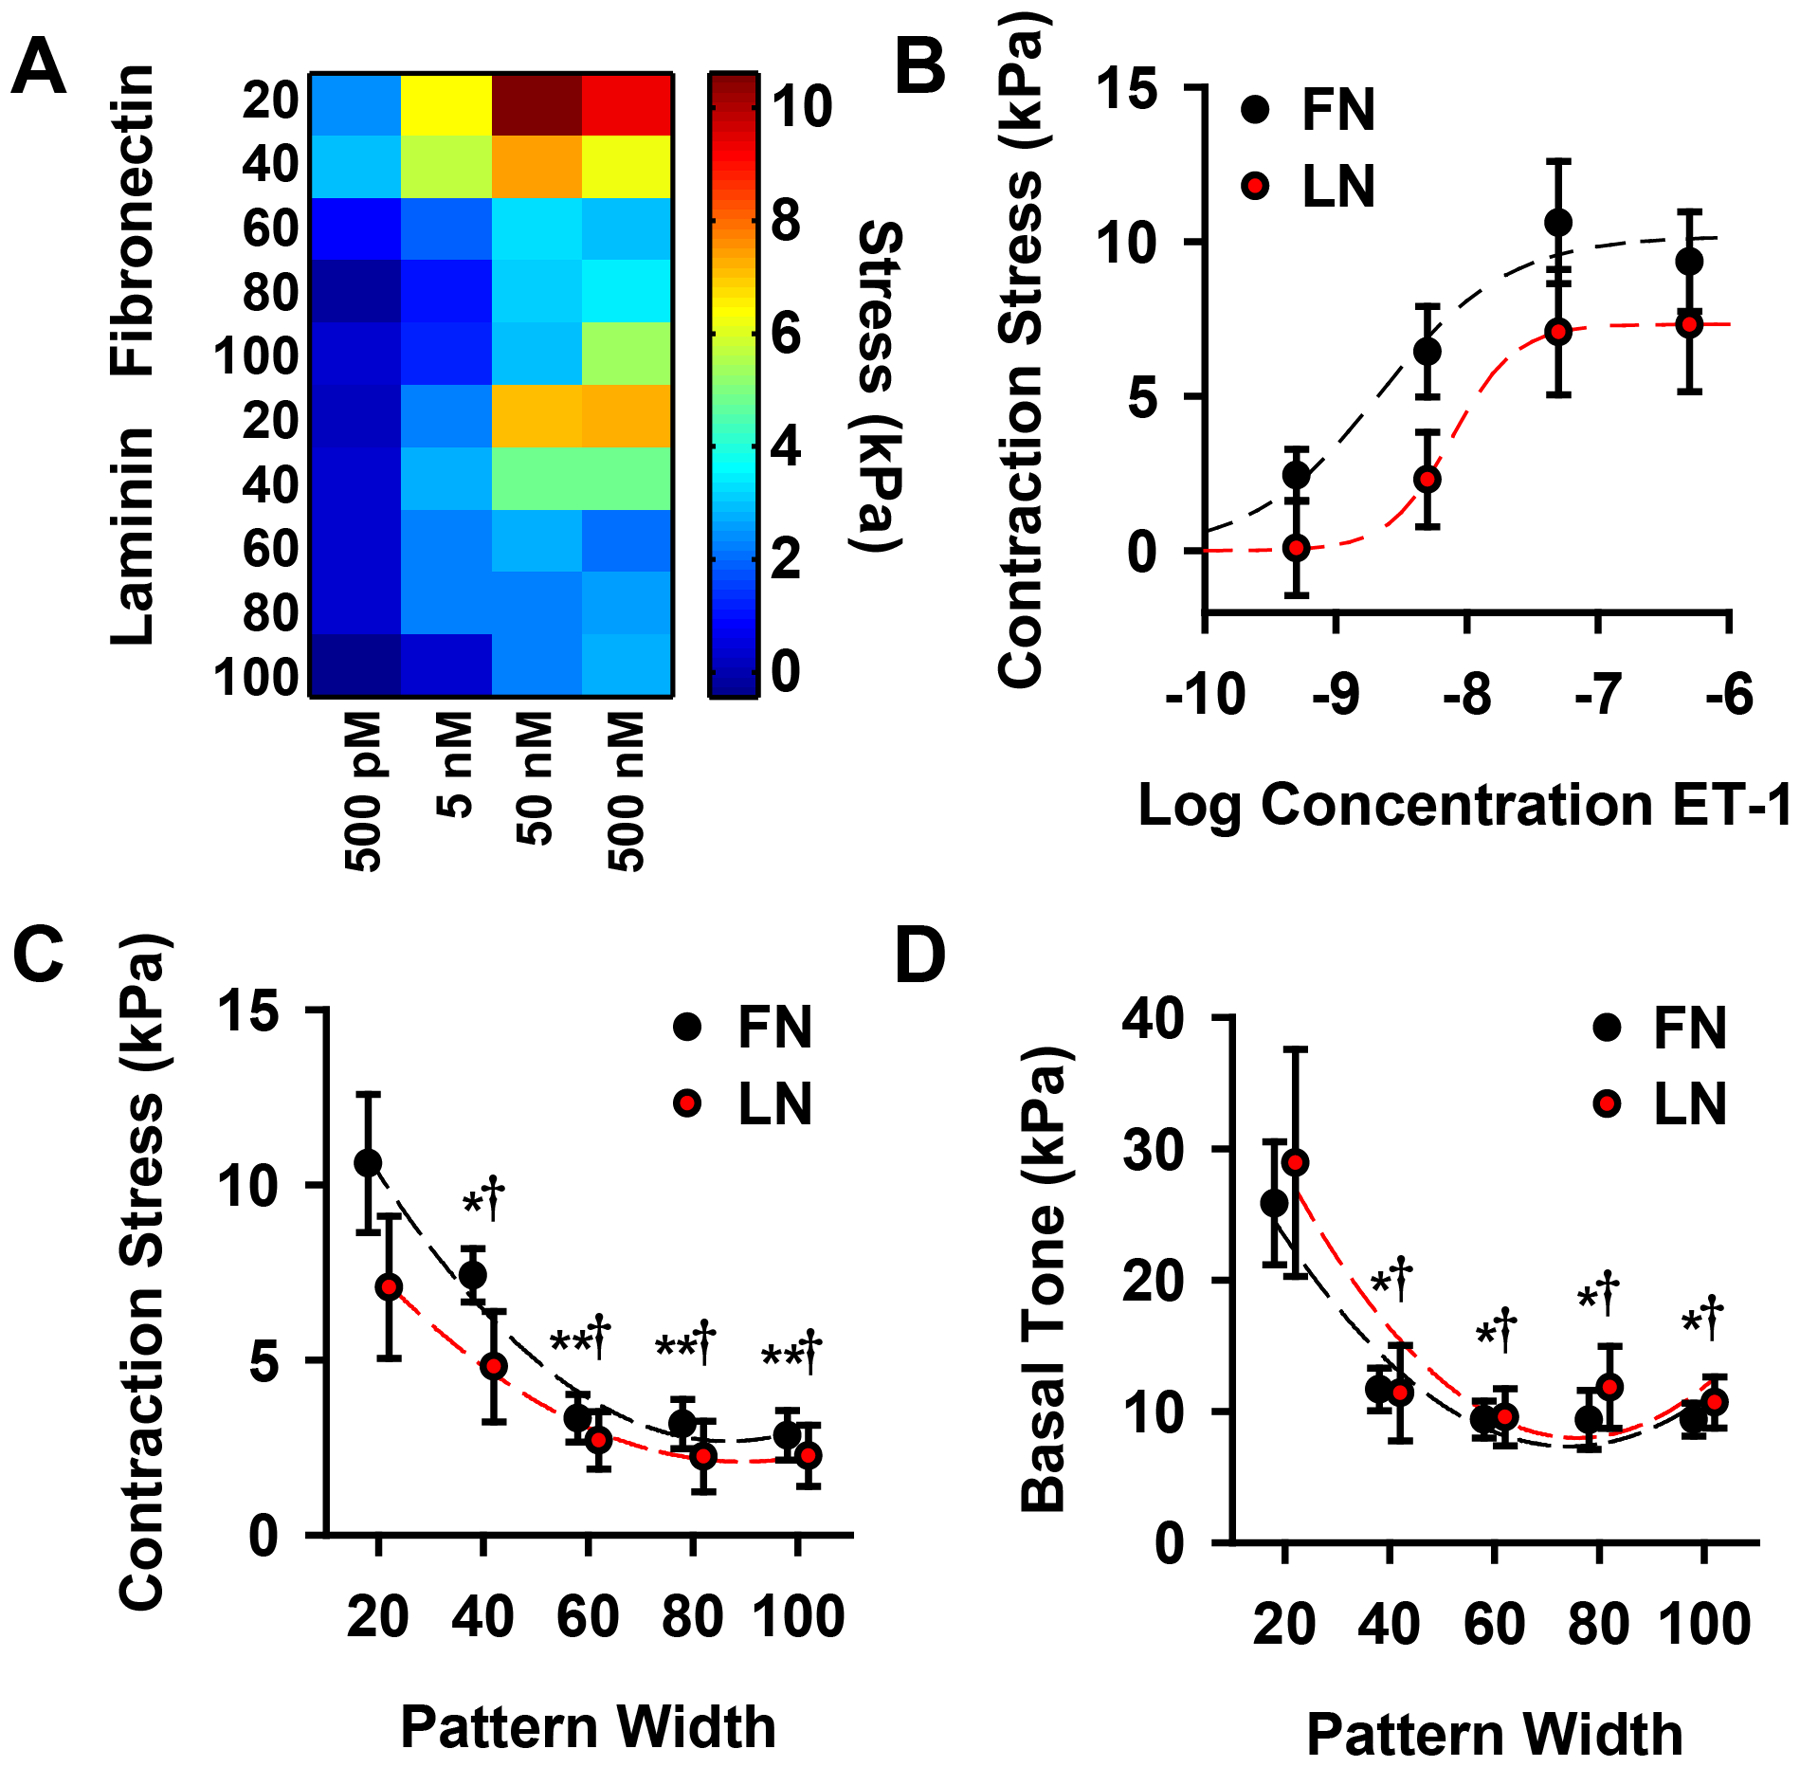
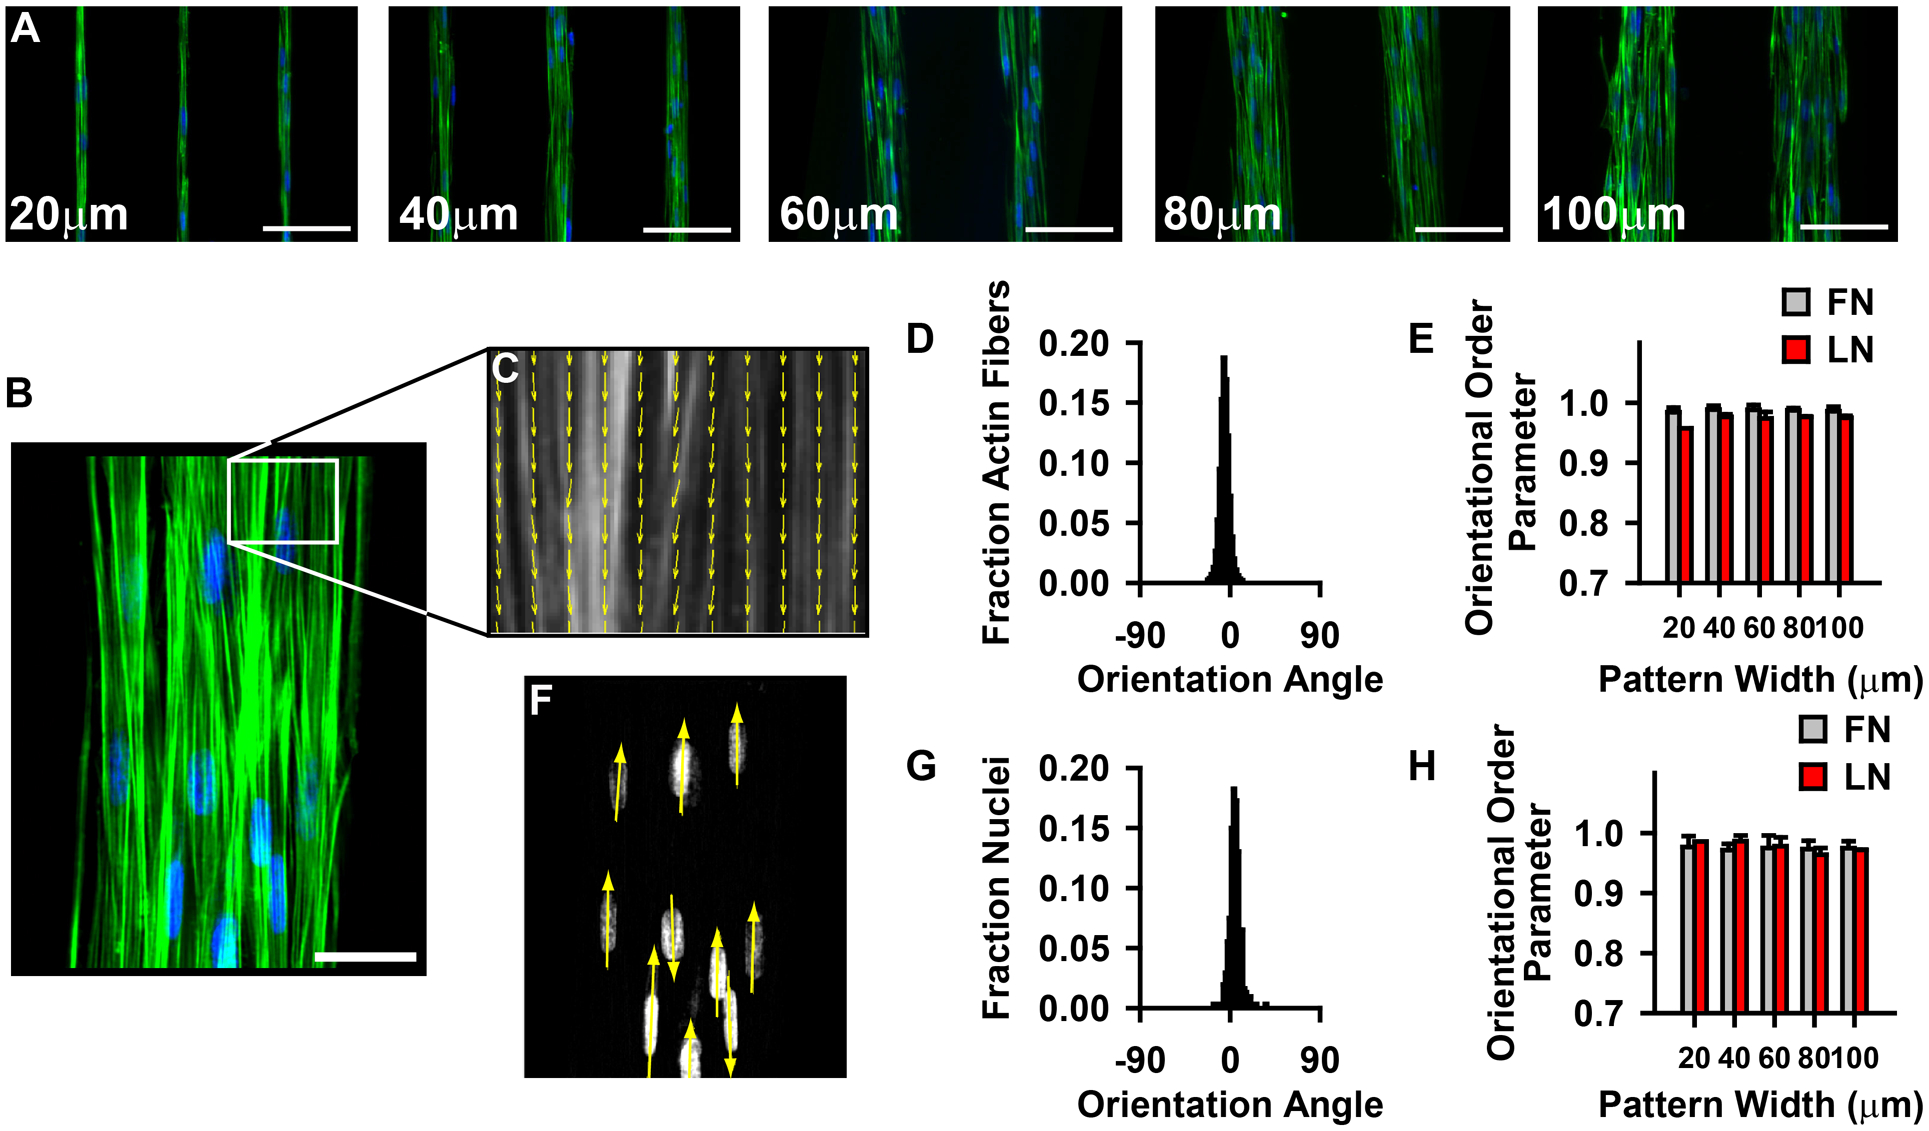
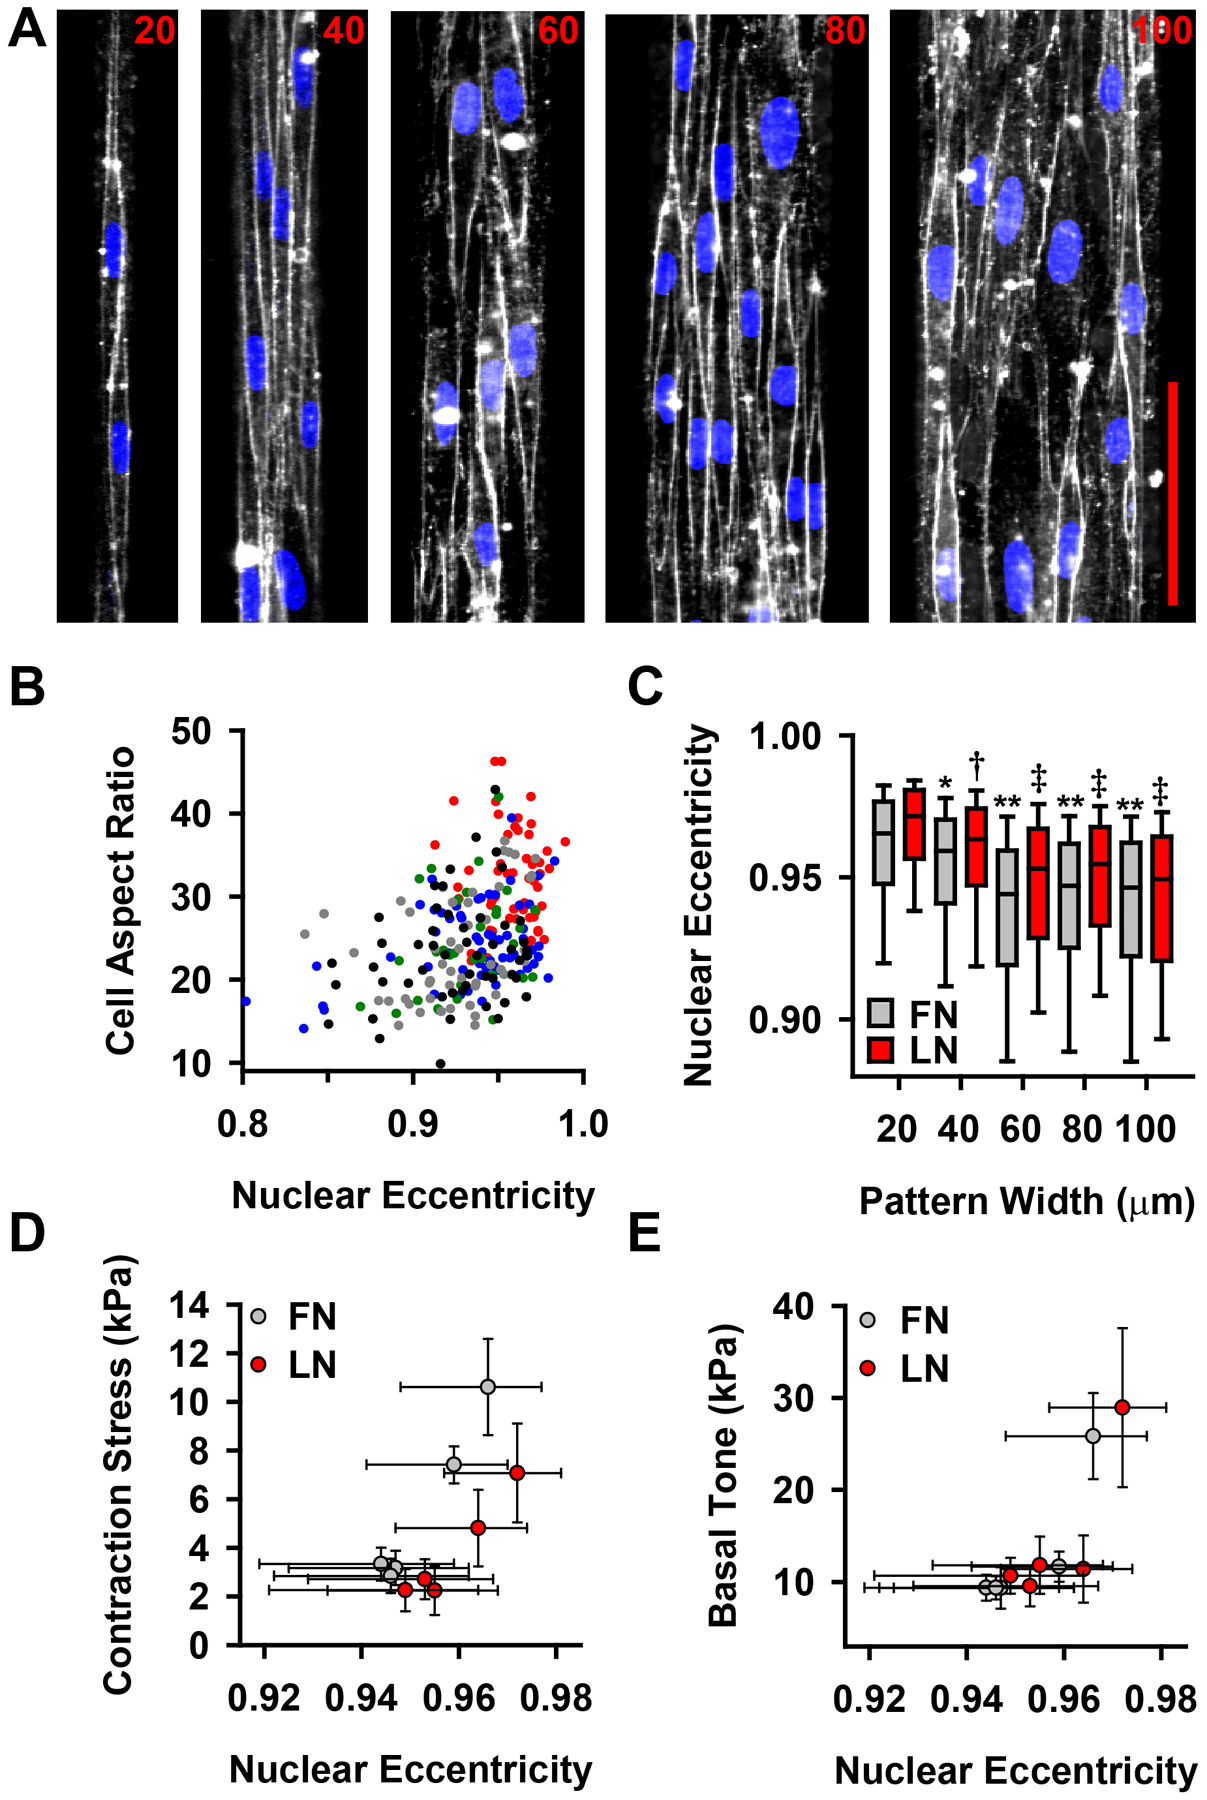
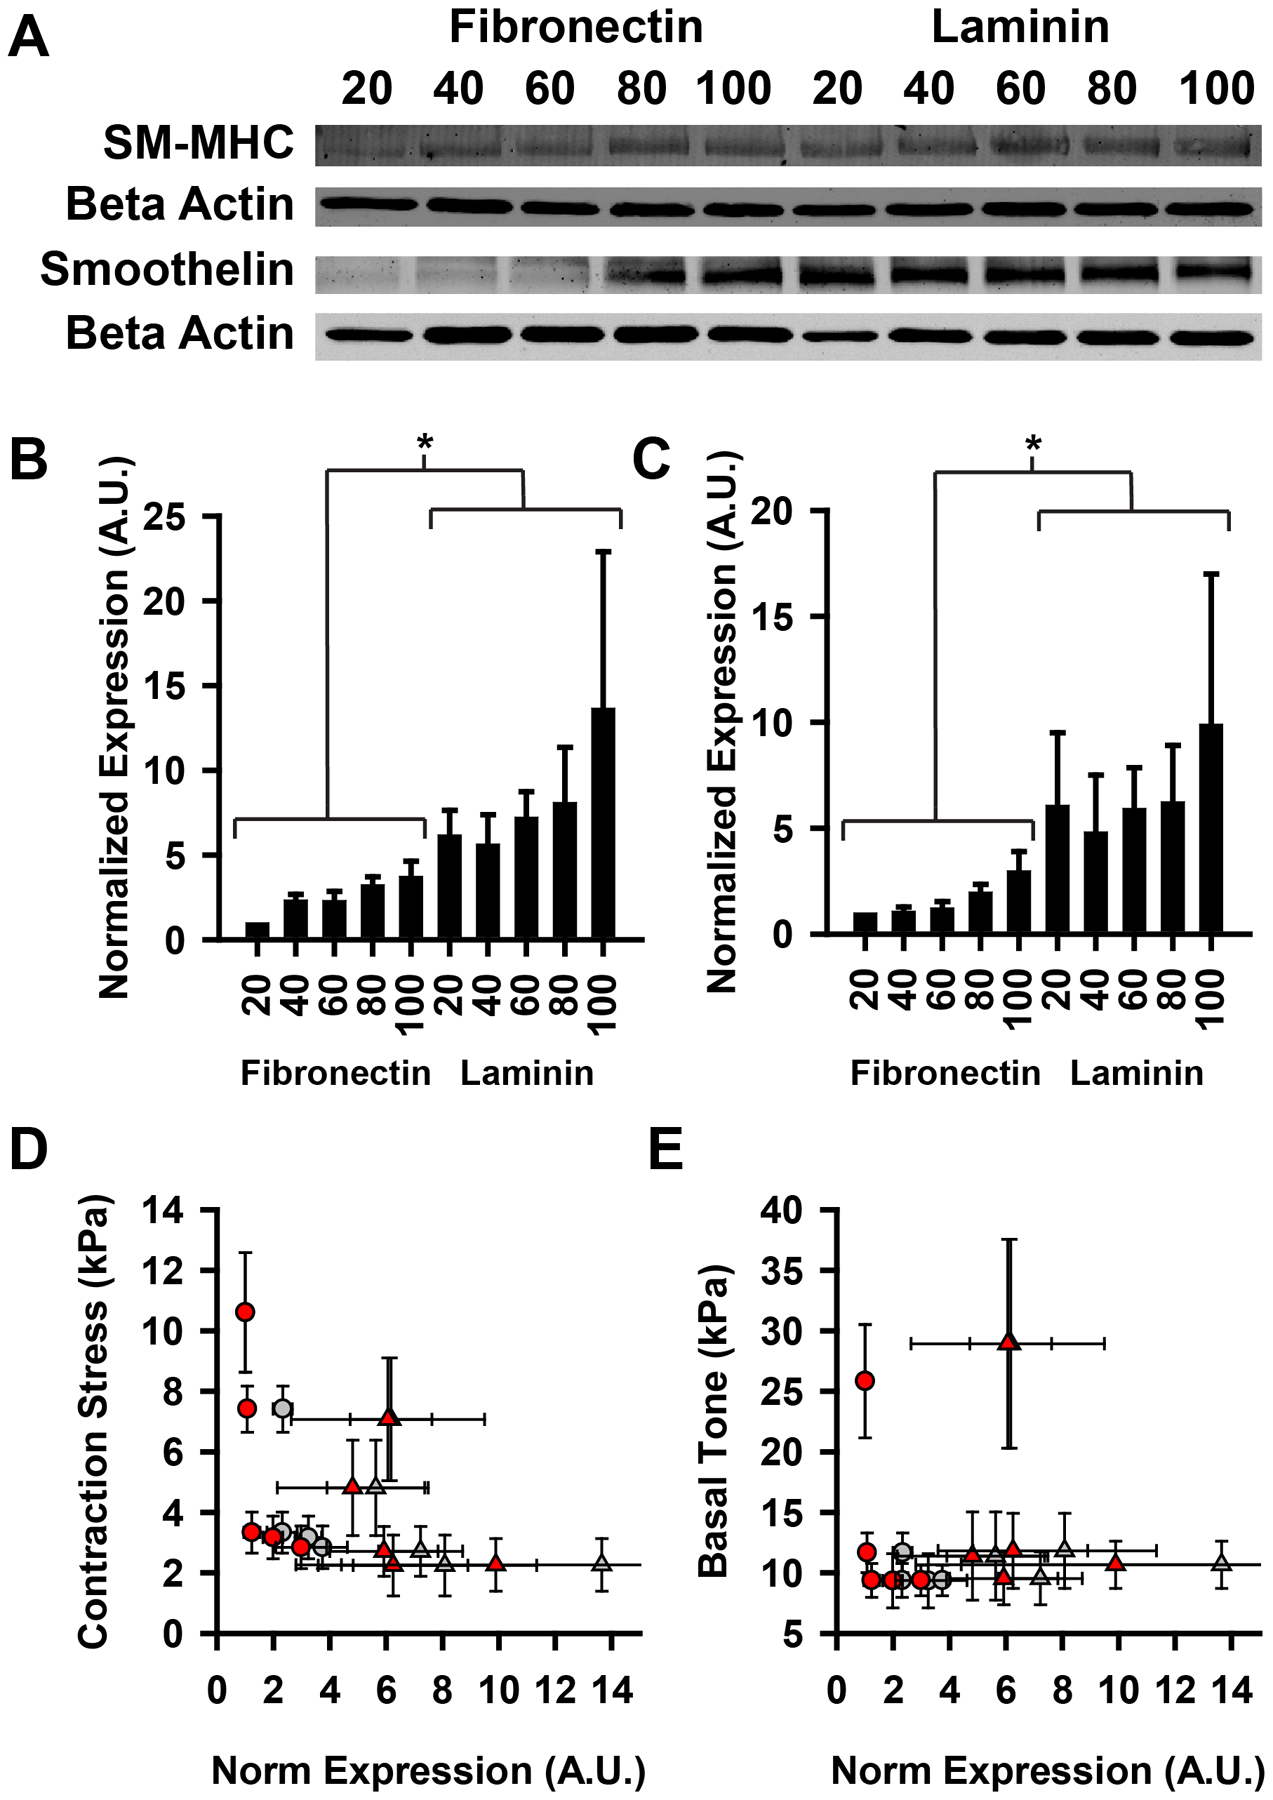
The physiologic role of smooth muscle structure in defining arterial function is poorly understood. We aimed to elucidate the relationship between vascular smooth muscle architecture and functional contractile output. Using microcontact printing and muscular thin film technology, we engineered in vitro vascular tissues with strictly defined geometries and tested their contractile function. In all tissues, vascular smooth muscle cells (VSMCs) were highly aligned with in vivo-like spindle architecture, and contracted physiologically in response to stimulation with endothelin-1. However, tissues wherein the VSMCs were forced into exaggerated spindle elongation exerted significantly greater contraction force per unit cross-sectional area than those with smaller aspect ratios. Moreover, this increased contraction did not occur in conjunction with an increase in traditionally measured contractile phenotype markers. These results suggest that cellular architecture within vascular tissues plays a significant role in conferring tissue function and that, in some systems, traditional phenotype characterization is not sufficient to define a functionally contractile population of VSMCs.


Figures

Figure 1:
Figure 1:
Microcontact printing used to provide spatial cues for vascular tissue self-organization. (A) Phase contrast images of VSMCs micropatterned into thin tissue lines of varying widths, indicated in each image, separated by 100 μm gaps. (scale bars =200 μm). (B) 3-D confocal image of 100 μm wide patterned VSMC tissue. (Green: f-actin, Blue: nuclei). Scale bar 100 μm. (C) Thickness map of tissue in B, using f-actin staining. (D) Tissue thickness as a function of pattern width and ECM (fibronectin (FN) and laminin (LN)) substrate (mean +/− SD).
Figure 2:
Figure 2:
Vascular muscular thin film (vMTF) construction and experimental methods. (A) Schematic representation of vMTF method. (B) Curvature of vascular muscular thin films was used to calculate change in tissue stress. (C) Example images from one vMTF experiment, pre ET-1 treatment (0 minutes), after 50 nM ET-1 stimulation (30 minutes) and following HA-1077 treatment (60 minutes). (D) Typical temporal apparent stress evolution for serial stimulation of vMTF with increasing doses of endothelin-1 followed by HA-1077.
Figure 3:
Figure 3:
Vascular tissue structure influences functional contractile output. (A) Heat map representing dose-response behavior of all tissue types, patterned on fibronectin (FN) and laminin (LN). (B) Typical sigmoidal dose-response curves for 20 μm wide lines patterned on both fibronectin and laminin. (C) Tissue contraction induced by 50 nM ET-1 stimulation for all tissues. (D) Basal contractile tone for all tissues. (for F,G; * = statistically different from 20 μm FN tissue, †=statistically different from 20 μm LN tissue, **=statistically different from both 20 μm and 40 μm FN tissue, p<0.05). All plots: mean +/− SEM.
Figure 4:
Figure 4:
Constrained tissue structure does not significantly alter subcellular organization. (A–B) Phalloidin and DAPI stained images of patterned tissues. (Green: f-actin, Blue: nuclei). (A) scale bar = 100 μm (B) scale bar = 50 μm. (C) Actin orientation map for a representative region of the tissue in (B). (D) Histogram of actin orientation angles in 100 μm wide tissues. (E) F-actin orientational order parameter for all tissue patterns. (FN: fibronectin, LN: laminin; mean +/− sd) (F) Nuclear orienatation map for nuclei in (B). (G) Histogram of nuclear orientation in 100 μm wide tissues. (H) Nuclear orienational order parameter for all tissue patterns. (FN: fibronectin, LN: laminin; mean +/− sd)
Figure 5:
Figure 5:
Cell and nuclear morphology correlate with VSMC functional output. (A) Di-8 membrane (white) and DAPI nuclear (blue) stained micropatterned vascular tissues. scale bar=100 μm (B) Correlation between cell aspect ratio and nuclear eccentricity. Each circle represents a single cell. Color indicates tissue width of measured cell (red: 20 μm, blue: 40 μm, green: 60 μm, gray: 80 μm, black: 100 μm). Pearson correlation of cell aspect ratio and nuclear eccentricity: r=0.346, p=1.66e-7. (C) Nuclear eccentricity for patterned vascular tissues (* = statistically different from 20 μm FN tissue, †=statistically different from 20 μm LN tissue, **=statistically different from both 20 μm and 40 μm FN tissue, ‡ = statistically different from both 20 μm and 40 μm LN tissue, p<0.05) box: 25–75%, error bars: 10–90% (D) Nuclear eccentricity correlates with contraction stress (see Fig 3C) following stimulation with 50 nM ET-1 (Pearson correlation: r=0.748, p=0.013). (E) Nuclear eccentricity correlates with basal contractile tone (see Fig 3D) (Pearson correlation: r=0.823, p=0.008). (D–E) Error bars: x: 25–75% (from (C)), y: SEM (from Fig 3 C,D). Reported p values for Pearson correlations are two-tailed, demonstrating that the correlation is significantly different from zero.
Figure 6:
Figure 6:
Contractile phenotype protein expression does not correlate with contractile output. (A) Example western blot for contractile markers smooth muscle myosin heavy chain and smoothelin. (B) Quantified expression of SM-MHC. *=FN and LN statistically different from one another (p<0.05). (C) Quantified expression of smoothelin. *=FN and LN statistically different from one another (p<0.05). (D–E) Contractile stress and basal tone plotted against quantified expression of SM-MHC and smoothelin. (circles: FN, triangles: LN, gray: SM-MHC, red: smoothelin) For correlation analyses, FN and LN data points were pooled and treated as one group. (D) Contraction stress. (Pearson correlation: r, p). SM-MHC: (−0.553, 0.975), smoothelin (−0.475, 0.166) (E) Basal tone. (Pearson correlation: r, p). SM-MHC: (−0.179,0.621), smoothelin: (−0.031, 0.933). All error bars mean +/− SEM. (D-E) Reported p value is two-tailed, demonstrating that the correlations are not significantly different from zero.

References

    1. Chen CS, Mrksich M, Huang S, Whitesides GM, Ingber DE. Geometric control of cell life and death. Science. 1997;276:1425–1428 - PubMed
    1. Parker KK, Brock AL, Brangwynne C, Mannix RJ, Wang N, Ostuni E, Geisse NA, Adams JC, Whitesides GM, Ingber DE. Directional control of lamellipodia extension by constraining cell shape and orienting cell tractional forces. Faseb J. 2002;16 - PubMed
    1. Nelson CM, Jean RP, Tan JL, Liu WF, Sniadecki NJ, Spector AA, Chen CS. Emergent patterns of growth controlled by multicellular form and mechanics. Proc Natl Acad Sci U S A. 2005;102:11594–11599 - PMC - PubMed
    1. Bray MA, Sheehy SP, Parker KK. Sarcomere alignment is regulated by myocyte shape. Cell Motil Cytoskeleton. 2008;65:641–651 - PMC - PubMed
    1. Parker KK, Tan J, Chen CS, Tung L. Myofibrillar architecture in engineered cardiac myocytes. Circ Res. 2008;103:340–342 - PMC - PubMed

Publication types

MeSH terms