. 2011 Dec 15;27(24):3371-8.
doi: 10.1093/bioinformatics/btr572. Epub 2011 Oct 12.

An automatic method for CASP9 free modeling structure prediction assessment

Affiliations

An automatic method for CASP9 free modeling structure prediction assessment

Qian Cong et al. Bioinformatics. .

Abstract

Motivation: Manual inspection has been applied to and is well accepted for assessing critical assessment of protein structure prediction (CASP) free modeling (FM) category predictions over the years. Such manual assessment requires expertise and significant time investment, yet has the problems of being subjective and unable to differentiate models of similar quality. It is beneficial to incorporate the ideas behind manual inspection to an automatic score system, which could provide objective and reproducible assessment of structure models.

Results: Inspired by our experience in CASP9 FM category assessment, we developed an automatic superimposition independent method named Quality Control Score (QCS) for structure prediction assessment. QCS captures both global and local structural features, with emphasis on global topology. We applied this method to all FM targets from CASP9, and overall the results showed the best agreement with Manual Inspection Scores among automatic prediction assessment methods previously applied in CASPs, such as Global Distance Test Total Score (GDT_TS) and Contact Score (CS). As one of the important components to guide our assessment of CASP9 FM category predictions, this method correlates well with other scoring methods and yet is able to reveal good-quality models that are missed by GDT_TS.

Availability: The script for QCS calculation is available at http://prodata.swmed.edu/QCS/.

Contact: grishin@chop.swmed.edu

Supplementary information: Supplementary data are available at Bioinformatics online.


Figures

Fig. 1.
Fig. 1.
Simplification of the target and models. (A) Target T0531: SSEs are colored in rainbow and one pair of residues where two SSEs interact with each other (defined as interaction) are highlighted in magenta. (B) Simplified T0531: the SSEs are represented by vectors and the interactions are represented by pairs of points illustrated by the purple dots. (C) A model for T0531 (TS399_4) colored in rainbow according to the target SSE definition with the same interaction defined in the target highlighted in magenta. (D) Simplified model TS399_4.
Fig. 2.
Fig. 2.
Illustration of SSE angle and handedness measurement. (A) The dark blue and dark green vectors represent a pair of SSEs in the target. The blue and green vectors represent the corresponding SSE pair in the model. The red arrow indicates the angle discrepancy between the target and the model. (B) The 3 SSE vectors (i(T), j(T) and k(T)) from the target are colored in dark blue, dark green and red, and the corresponding SSEs (i(M), j(M) and k(M)) in the model are in blue, green and orange. In both the target and the model, we define the reference plane (colored in light purple) as the one that passes through the centers of i, j and parallel to the general orientation of i and j (i+j when the angle between them is <90 and ij when their angle is >90). The cross product of i's projection on the reference plane and the vector connecting the centers of i and j represent the norm of this plane. After superimposing the reference planes in the target and in the model, the third vectors, k(T) and k(M) are on opposite sides of the plane, indicating an error in handedness. In such case, certain penalty would be introduced as in Equation (11). The black arrows show the distances (Dk,P(M), D k,P(T) and Di,j(T)) that are measured for handedness score.
Fig. 3.
Fig. 3.
The correlation between QCS and MIS on a set of CASP9 FM models, which was evaluated by manual inspection.
Fig. 4.
Fig. 4.
The Kendall tau rank correlation coefficient between QCS and GDT_TS on CASP9 FM targets (represented by blue dots) and TBM representatives (represented by red dots).
Fig. 5.
Fig. 5.
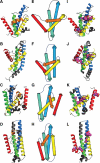
Example (Target 561) of QCS revealing models with good global topology and correct interactions. The first panel: the target or model structures; the second panel: the topology diagrams; the last panel: the structures with interactions colored in magenta. (A), (E), (I) target T0561; (B), (F), (J) the best model selected by QCS; (C), (G), (K) the best model selected by GDT_TS; (D), (H), (L) the best model selected by MIS.
Fig. 6.
Fig. 6.
Example (Target 618) of QCS revealing models with correct topology and global shape. (A) Structure of the target T0618 colored in rainbow; (B) the best model selected by QCS; (C) the best model selected by GDT_TS.
Fig. 7.
Fig. 7.
Example (Target 621) of QCS revealing models with superior global features. (A) The structure of target T0621 colored in rainbow; (B) the best model selected by QCS; (C) the best model selected by GDT_TS.
Fig. 8.
Fig. 8.
Example (Target 578) of GDT_TS and QCS revealing models with different advantages. (A) The structure of target T0578; (B) the structure of best model selected by QCS; (C) the structure of best model selected by GDT_TS.

Similar articles

Cited by

References

    1. Aloy P., et al. Predictions without templates: new folds, secondary structure, and contacts in CASP5. Proteins. 2003;53(Suppl. 6):436–456. - PubMed
    1. Ben-David M., et al. Assessment of CASP8 structure predictions for template free targets. Proteins. 2009;77(Suppl. 9):50–65. - PubMed
    1. Jauch R., et al. Assessment of CASP7 structure predictions for template free targets. Proteins. 2007;69(Suppl. 8):57–67. - PubMed
    1. Kinch L.N., et al. CASP5 assessment of fold recognition target predictions. Proteins. 2003;53(Suppl. 6):395–409. - PubMed
    1. Kinch L.N., et al. CASP9 target classification. Proteins. 2011a [Epub ahead of print, doi: 10.1002/prot.23190, September 14, 2011] - PMC - PubMed

Publication types